Although newspaper publishing has been described by many market specialists as a dying industry, it has had to undergo significant digital transformation to remain relevant. Due to the rise of modern technologies, traditional newspaper publishers are now faced with increasing pressure to attract and retain consumers.
Independent journalists, influencers and the new media are now able to capture a larger target audience and following through the targeted use of tech platforms. As a result, consumers have started to turn their attention away from physical newspapers, looking instead to online news sources.
Newspaper revenue statistics
Traditional newspaper publishers have needed to maximize different revenue sources instead of just relying solely on print sales. The development of newspaper websites that feature advertising and often paid online subscriptions have helped recuperate the lost revenue from the decline in physical newspaper sales.
- For US newspaper companies, total estimated revenue was $22.04 billion as of 2021, dropping 0.50% over the previous year.
- Of this figure, advertising space made up 46.14% ($10.17 billion) of revenue.
- Subscription and sales made up 39.83% ($8.78 billion) of revenue.
- Printing services made up 4.64% ($1.02 billion) of revenue.
- Distribution services made up 1.64% ($0.36 billion) of revenue.
- Other sources of revenue made up 7.75% ($1.71 billion) of revenue.
A graph is given below to show the estimated revenue for US newspaper companies:

Newspaper sales statistics
Whereas the sale of physical newspapers has remained more popular with older audiences, digital news sales have a greater appeal to younger generations. As future news readers become increasingly tech-literate, the demand for printed newspapers is anticipated to decline and become displaced by apps, social media and online news websites.
- Global revenue for the print newspaper and magazine market is expected to drop 13.05% from 2023’s $127.20 billion to $110.60 billion by 2027.
- However, global revenue for the digital newspaper and magazine market is expected to grow 11.37% from 2023’s $38.60 billion to $42.99 billion by 2027.
- As of 2022, the Wall Street Journal has the highest annual print circulation of US newspapers (254.58 million).
- As of 2018, over 124 million adults in the US read newspaper media each week.
- 9 of the top 10 global newspapers ranked by circulation were Asian, as of 2016.
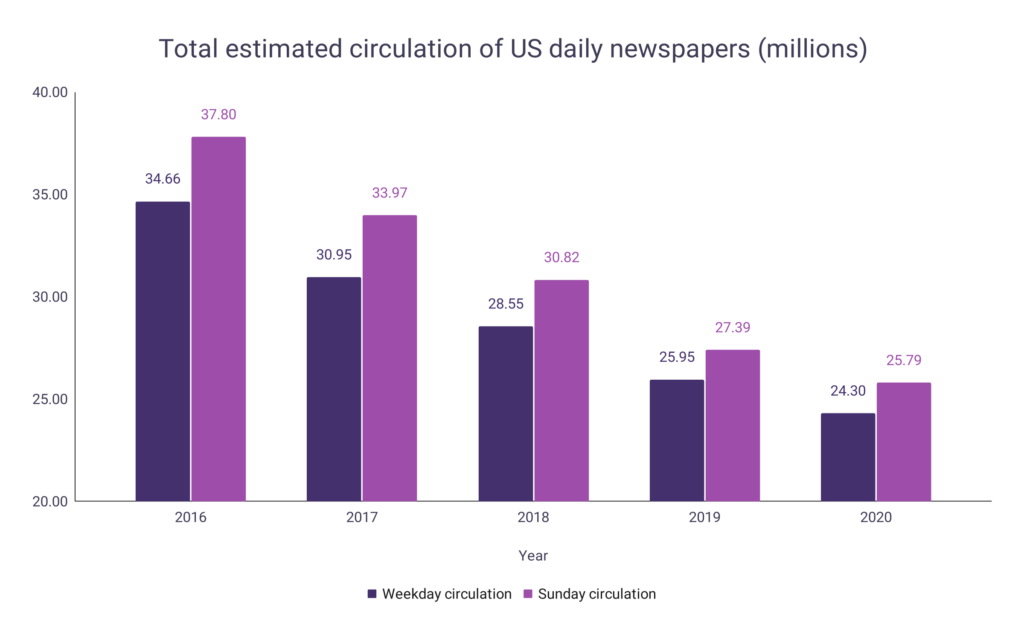
A graph is given below to show the total estimated circulation of US daily newspapers:
Newspaper price statistics
Pricing remains an important issue for newspaper companies as the industry comes to term with a change in consumer behavior caused by digital platforms. Many traditional newspapers offer online subscriptions to attract modern consumers towards historically trusted newspaper titles for a fee.
- As of 2022, US newspapers and magazines were priced 43.43% higher on average than in 2013.
- Approximately 20% of consumers are willing to pay for their news.
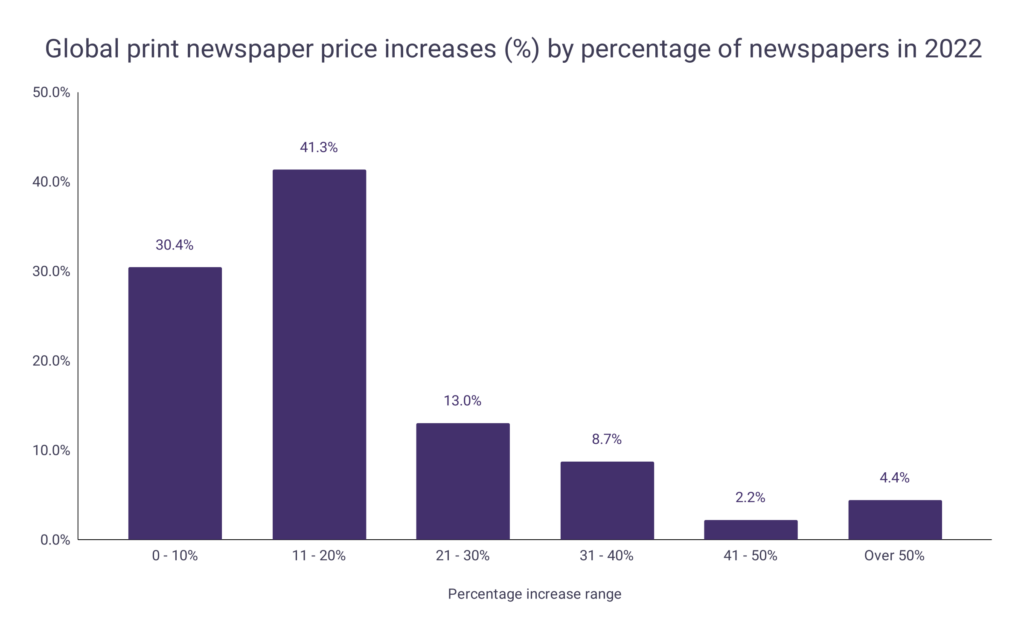
- 64.8% of newspaper publishers had raised their print prices within the previous year.
- The price of newsprint in the US rose to around $800 a ton.
- As of 2021, average annual US expenditure on newspapers decreased to $25.36 (per consumer unit), more than $10 lower than the previous year.
A graph is given below to show global print newspaper price increases (%) by percentage of newspapers for the given data in 2022:
Newspaper companies
The gradual decline in the number of newspaper companies has come as no surprise to many within the industry. Legacy newspaper publishing companies have needed to adapt their online content strategy to become more reactive, engaging and shareable, which has created a highly competitive digital space.
- As of 2022, The Wall Street Journal’s average printed weekday circulation was 697,493.
- The WSJ also had 3.75 million news subscribers during the year.
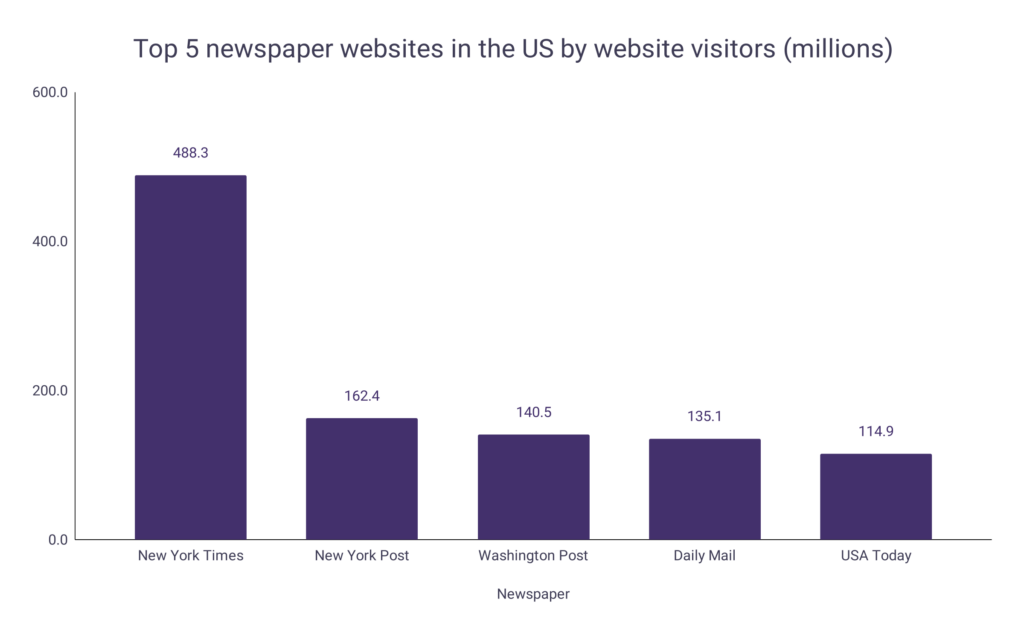
- The New York Times received over 488 million website visits in Jan 2023.
- This was over 3x more than the second-most visited newspaper website in the US.
- Between 2014 and 2020, average monthly unique visitors to the top 50 US newspaper websites increased by 68.53%.
A graph is given below to show the top 5 most visited newspaper websites in the US (visits from Jan 23):
Number of US newspaper companies
- As of 2020, the total number of US newspaper companies was 6,567.
- This was a decrease of 3.38% from 2019’s 6,797.
- Since 2012, the number of US newspaper companies has declined by 13.86%.
- This was a decline of 1.73% per year on average.
| Year | Number of companies | Change |
| 2020 | 6,567 | – 3.38% |
| 2019 | 6,797 | + 1.55% |
| 2018 | 6,693 | – 7.32% |
| 2017 | 7,222 | – 3.66% |
| 2016 | 7,496 | + 4.62% |
| 2015 | 7,165 | – 2.98% |
| 2014 | 7,385 | – 1.27% |
| 2013 | 7,480 | – 1.89% |
| 2012 | 7,624 |
A graph is given below to show the number of US newspaper companies:

Number of US newspaper companies by size
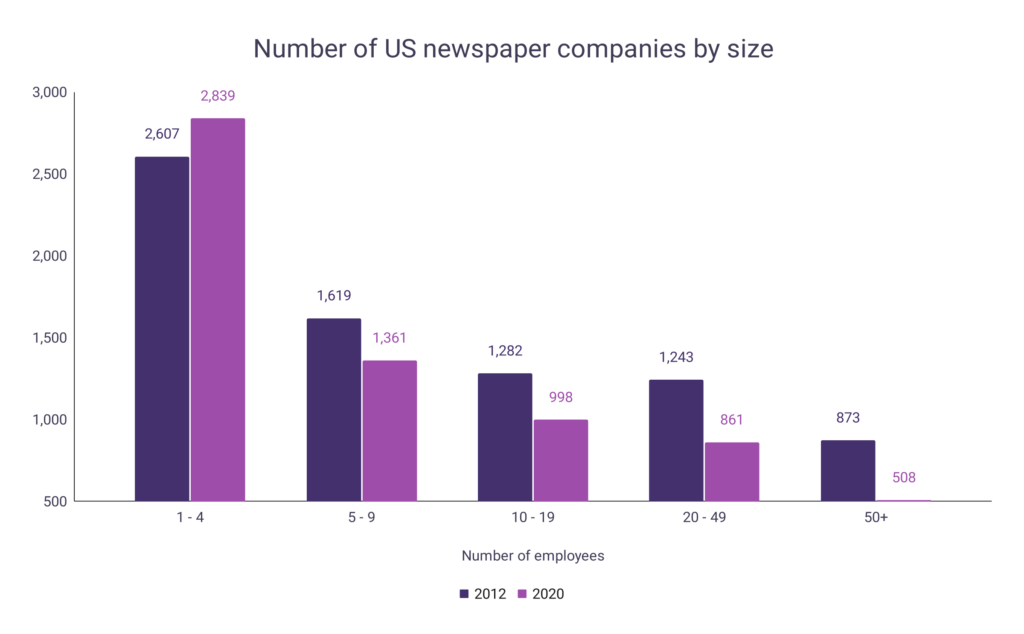
- As of 2020, 43.23% of US newspaper companies had between 1 – 4 employees.
- 20.72% of US newspaper companies had between 5 – 9 employees.
- 15.20% of US newspaper companies had between 10 – 19 employees.
- 13.11% of US newspaper companies had between 20 – 49 employees.
- 7.74% of US newspaper companies had 50+ employees.
| Employees | 2012 | 2020 | Change |
| 1 – 4 | 2,607 | 2,839 | + 8.90% |
| 5 – 9 | 1,619 | 1,361 | – 15.94% |
| 10 – 19 | 1,282 | 998 | – 22.15% |
| 20 – 49 | 1,243 | 861 | – 30.73% |
| 50 – 99 | 423 | 275 | – 34.99% |
| 100 – 249 | 297 | 168 | – 43.43% |
| 250 – 499 | 98 | 47 | – 52.04% |
| 500 – 999 | 39 | 12 | – 69.23% |
| 1,000 + | 16 | 6 | – 62.50% |
A graph is given below to show the number of US newspaper companies by size:
European newspaper publishing statistics
- Daily printed newspaper consumption within the EU stood at 21% as of 2022, declining 16% since 2012.
- On average, trust in the written press in Europe stands at 49%.
- Newspapers are the least used news source across the UK, France, Spain, Germany and Italy as of 2022.
A graph is given below to show the largest UK newspapers by their average print circulation:

Asian newspaper publishing statistics
- Indian newspapers make up 70% of the top 10 Asian newspapers by circulation.
- Japanese newspapers make up 30% of the top 10 Asian newspapers by circulation.
- As of 2022, Yomiuri Shimbun had the largest daily circulation (8.64 million) of Asian newspapers with data available.
A graph is given below to show the top 5 ranked Asian newspapers by their daily circulation figures:

Newspaper employee statistics
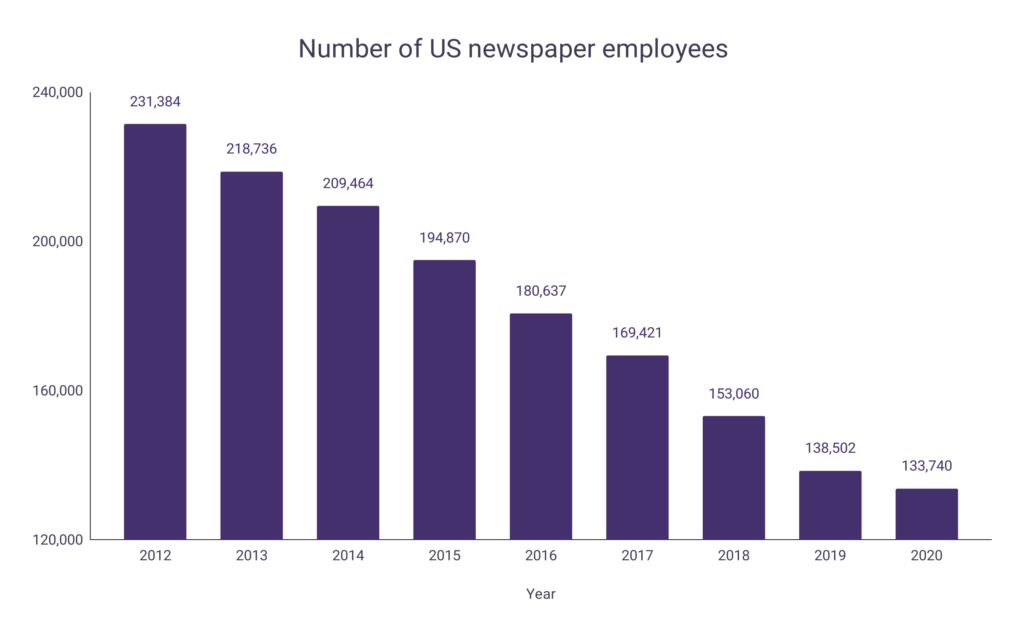
The number of employees within newspaper companies has been declining steadily, likely due to cuts within the industry and an increase in the need for shorter-form content which can be created more easily. Despite this, average annual salaries have increased, showing professionals can continue to be rewarded if they retain their positions.
- In the US, the total number of newspaper employees was 133,740 as of 2020.
- The total annual payroll of newspaper employees was $6.60 billion.
- The average salary of a newspaper employee was $49,349.
- In the US, 46% of employees in newspaper companies were female as of 2022.
- The median age of a newspaper company employee was 49.20 years old.
A graph is given below to show the number of US newspaper employees:
Newspaper Publishing FAQ
How much does a newspaper ad cost?
- In general, small ads can cost $50 as a minimum.
- However, full page ads can range from $2,700 upwards to $100,000.
- The large price variation of newspaper ads can be due to:
- The circulation of the newspaper
- The size of the ad
- The ink used
- The day of its publication
How many people read the newspaper?
- As of 2012, more than 2.5 billion people read the newspaper in a print format and over 600 million read in digital formats.
- However, as of 2023, print newspaper readership has continued to decline whilst in contrast, digital readers have increased.
When was the first newspaper created?
- In 1566, the first handwritten news sheets were circulated in Venice, which contained information on politics and war.
- However, the first regular printed newspapers were available by 1605 in Strasbourg, Germany.

