
Educational publishing accounts for 31.28% of the publishing industry’s revenue as of 2022. While the educational segment bounced back from the terrible 2020, it’s still growing slower than the industry overall.
- As of 2022, educational books generated over $8.79 billion in sales revenue in the United States.
- Textbook sales grew by 9.46% compared to 2021, continuing the growth of this segment after the drop during the pandemic-affected 2020 calendar year.
- 2022 was the second-best year for educational sales over the past 10 years, trailing only $9.12 billion generated during 2014.
- Overall, educational book sales grew by 25.04%% over the last 5 years and 1.62% since 2013.
- Educational book sales are growing more slowly than book sales overall, as the publishing industry has grown by 11.3% over the last 5 years and 8.35% since 2013.
| Year | Educational books revenue ($ billion) | Growth |
| 2013 | $8.65 | |
| 2014 | $9.12 | 5.43% |
| 2015 | $8.64 | -5.26% |
| 2016 | $7.69 | -11.00% |
| 2017 | $7.65 | -0.52% |
| 2018 | $7.03 | -8.10% |
| 2019 | $7.68 | 9.25% |
| 2020 | $6.97 | -9.24% |
| 2021 | $8.03 | 15.21% |
| 2022 | $8.79 | 9.46% |
| 5-year growth | 25.04% | |
| 10-year growth | 1.62% |

- Educational book revenue accounted for 31.87% of the total publishing revenue in the United States in 2022, an increase from 28.24% a year before.
- Educational books had the biggest share in the publishing revenue in 2022 ever since 2014.
- Over the last 5 years, the share of the educational segment in the industry’s revenue grew by 16.53%.
| Year | Educational books revenue ($ billion) | Book industry revenue ($ billion) | Share of educational book sales |
| 2013 | $8.65 | $27.07 | 31.95% |
| 2014 | $9.23 | $27.96 | 33.02% |
| 2015 | $8.60 | $27.80 | 30.94% |
| 2016 | $7.60 | $26.27 | 28.92% |
| 2017 | $7.63 | $26.35 | 28.94% |
| 2018 | $6.95 | $25.41 | 27.35% |
| 2019 | $7.99 | $26.04 | 30.67% |
| 2020 | $6.85 | $26.11 | 26.22% |
| 2021 | $8.28 | $29.33 | 28.24% |
| 2022 | $8.96 | $28.10 | 31.87% |
| 5-year growth | 28.86% | 10.59% | 16.53% |
| 10-year growth | 3.54% | 3.80% | -0.25% |

PreK-12 book sales are on the rise within the educational sector, while higher-ed book sales have been declining over the last decade:
- In 2022, K-12 books generated $5.61 billion in revenue in the United States. This was a 16.63% increase compared to 2021, which also had a huge growth compared to 2020.
- Higher-ed book sales were at $3.18 billion in 2022, declining by 1.24% compared to 2021.
- Since 2019, K-12 textbooks have started generating more sales revenue than higher-ed textbooks in the United States.
- K-12 textbook sales have grown by 67.46% over the last years and 46.09% since 2013.
- At the same time, higher-ed book sales are declining – dropping by 13.59% over the last 5 years and over 33.89% since 2013.
| Year | K-12 sales revenue ($ billion) | K-12 growth | Higher-ed sales revenue ($ billion) | Higher-ed growth |
| 2013 | $3.84 | $4.81 | ||
| 2014 | $4.27 | 11.20% | $4.85 | 0.83% |
| 2015 | $4.11 | -3.75% | $4.53 | -6.60% |
| 2016 | $3.73 | -9.25% | $3.96 | -12.58% |
| 2017 | $3.64 | -2.41% | $4.01 | 1.26% |
| 2018 | $3.35 | -7.97% | $3.68 | -8.23% |
| 2019 | $4.38 | 30.75% | $3.30 | -10.33% |
| 2020 | $3.84 | -12.33% | $3.13 | -5.15% |
| 2021 | $4.81 | 25.26% | $3.22 | 2.88% |
| 2022 | $5.61 | 16.63% | $3.18 | -1.24% |
| 5-year growth | 67.46% | -13.59% | ||
| 10-year growth | 46.09% | -33.89% |

- As of 2022, preK-12 books account for 62.64% of the educational revenue in the US, while the share of college textbook revenue stands at 37.36%.
- For the first time over the last 10 years, K-12 books account for more than 60% of the educational revenue in the country. This is also the fourth year in a row where K-12 sales revenue represents the majority of the educational revenue in the US.
- Over the last 5 years, the share of K-12 book sales revenue in the educational segment increased by 29.96%, and the growth is over 41.10% over the last 10 years.
- On the other hand, the share of college book sales revenue in the educational segment declined by 27.87% over the last 5 years and more than 31% over the last 10 years.
| Year | K-12 share | K-12 growth | College share | College growth |
| 2013 | 44.39% | 55.61% | ||
| 2014 | 46.25% | 4.19% | 53.75% | -3.34% |
| 2015 | 47.78% | 3.30% | 52.22% | -2.84% |
| 2016 | 49.09% | 2.76% | 50.91% | -2.52% |
| 2017 | 47.73% | -2.78% | 52.27% | 2.68% |
| 2018 | 48.20% | 0.98% | 51.80% | -0.89% |
| 2019 | 54.84% | 13.77% | 45.16% | -12.81% |
| 2020 | 56.09% | 2.28% | 43.91% | -2.77% |
| 2021 | 58.07% | 3.54% | 41.93% | -4.53% |
| 2022 | 62.64% | 7.86% | 37.36% | -10.89% |
| 5-year growth | 29.96% | -27.87% | ||
| 10-year growth | 41.10% | -32.81% |

The price of textbooks over time
- Between 1977 and 2015, the cost of textbooks increased by over 1000%.
- Textbook costs rose 67% from 2008 to 2018.
- Hardcopy books can cost as much as $400.00, with the average price between $80 and $150.
- The price of textbooks increases by an average of 12% with each new edition but can cost up to 50% more.
- New editions come out every 3-4 years on average.
Who makes money from college textbooks?
- The average higher-ed textbook costs around $105.37.
- From the sales of the average college textbook:
- The publisher receives 66%, of which 7% is profit.
- The author receives 11.60% royalties.
- The campus store receives 22.40%, of which 4.50% is profit.
- McGraw-Hill’s profit margin is 25%, whereas Pearson’s is 10%

The impact of the price of textbooks on a student’s education
- Students purchase an average of 10 textbooks over an academic year
- 65% of students admit they have skipped buying a textbook because they are so expensive
- 90% of students believe not buying textbooks can have a serious impact on their grades
- 21% of students have skipped buying access codes to online textbooks and resources due to price
- Access codes also provide access to homework assignments and quizzes, meaning forgoing access codes directly impacts grades.
- 82% of students who have skipped a meal due to their financial situation have also skipped buying textbooks due to the cost
- 38% of students who have skipped a meal due to their financial situation have also admitted skipping access codes — almost twice as many as the national average of 21%
- 58% of college students share textbooks with friends
- 33% have used financial aid for their textbooks
- 19% of students have stated the cost of books has influenced their decision on what classes to take
- 71% of colleges believe new editions of textbooks are rarely justified
Educational books build vocabulary and critical thinking. So do word games. WordsRated’s Unscramble Words and Wordle Solver are free tools for players at every level. We also publish hints for today’s Connections daily, and our Word Scramble is great for anyone who wants to practise finding words from a jumbled set of letters.
K12
As of 2021, over 49.45 million students are enrolled in public schools in the United States, from pre-kindergarten to 12th grade. We decided to dive into the statistics on how much almost 50 million children spend on educational books and compiled the most comprehensive report on K-12 textbook sales in the United States.
PreK-12 textbook sales by year
- Over $5.61 billion was generated in preK-12 textbook sales revenue in the United States in 2022.
- The preK-12 segment had another big year in 2022 as revenues grew by 16.63% over 2021.
- 2021 was a huge bounce-back year for K-12 textbook sales, as the revenue jumped by 25.3% over 2020 levels.
- Pandemic-impacted 2020 decreased sales of K-12 educational material by 12.3% after a huge sales boom in 2019.
- Overall, 2022 was another record year for preK-12 book textbooks in terms of sales revenue.
- Revenue from K-12 educational books has increased by over $2.26 billion over the last 5 years.
| Year | PreK-12 sales revenue ($ billion) | Growth |
| 2013 | $3.84 | |
| 2014 | $4.27 | 11.20% |
| 2015 | $4.11 | -3.75% |
| 2016 | $3.73 | -9.25% |
| 2017 | $3.64 | -2.41% |
| 2018 | $3.35 | -7.97% |
| 2019 | $4.38 | 30.75% |
| 2020 | $3.84 | -12.33% |
| 2021 | $4.81 | 25.26% |
| 2022 | $5.61 | 16.63% |

Over the last several years, preK-12 book sales became the dominant source of revenue for the educational publishing industry, taking over from the higher-ed segment:
- In 2022, over 63.82% of the educational publishing revenue came from preK-12 textbooks.
- This was the fourth year in a row in which preK-12 books account for more than half of the industry’s sales revenue.
- In 2013, preK-12 textbooks accounted for only 44.4% of the industry’s revenue.
- The share of this segment in the industry’s total increased by 43.77% over the last 9 years.
- 7 over the last 9 years, this segment grew faster than the educational industry. However, since 2013 only 3 times did the educational industry record growth in sales year-over-year.
| Year | K-12 sales ($ billion) | Educational sales ($ billion) | Share of K-12 in educational sales |
| 2013 | $3.84 | $8.65 | 44.39% |
| 2014 | $4.27 | $9.12 | 46.82% |
| 2015 | $4.11 | $8.64 | 47.57% |
| 2016 | $3.73 | $7.69 | 48.50% |
| 2017 | $3.64 | $7.65 | 47.58% |
| 2018 | $3.35 | $7.03 | 47.65% |
| 2019 | $4.38 | $7.68 | 57.03% |
| 2020 | $3.84 | $6.97 | 55.09% |
| 2021 | $4.81 | $8.03 | 59.90% |
| 2022 | $5.61 | $8.79 | 63.82% |

The average price of K-12 textbooks
It’s very difficult to estimate how much the average K-12 student spends on textbooks in the US. This is due to the fact that over 60% of students reported that they purchased their textbooks either online or second-hand.
The other reason is the lack of recent publicly-available data on the average price of new textbooks. Our estimates, based on the 2011 survey of North Caroline K-12 students and the rate of inflation in the US, show that:
- The average math textbook for K-12 costs around $57.34 for elementary school students, $72.32 for middle school, and $86.14 for high school.
- Reading textbooks cost around $40.4 for elementary, $77.86 for middle school, and around $66.31 for high school.
- Science textbooks will cost around $54.81, $70.19, and $77.64 for elementary, middle, and high school, respectively.
- Social studies textbooks stand around $51.19 for elementary, $72.80 for middle school, and $88.79 for high school students.
- The average K-12 student will need around 19.9 textbooks per semester or around 39.8 books for a full school year.
- Based on these estimates, the average elementary school student will spend between $1,608.08 and $2,282.25 on textbooks for every school year if they want to buy only new textbooks.
- Middle school students’ expenditure on new textbooks is between $2,793.44 and $3,098.71.
- For high schoolers, between $2,639.26 and $3,533.84 is needed for new textbooks each school year.
- However, the estimates are that the average student spends between $910 and $1300 for textbooks, which indicates that a good portion of purchased K-12 textbooks are obtained on the second-hand market.
| Expenditure on new textbooks | Elementary | Middle school | High school |
| Math | $57.34 | $72.32 | $86.14 |
| Reading | $40.40 | $77.86 | $66.31 |
| Science | $54.81 | $70.19 | $77.64 |
| Social studies | $51.19 | $72.80 | $88.79 |
| Minimum expenditure on new textbooks | $1,608.08 | $2,793.44 | $2,639.26 |
| Maximum expenditure on new textbooks | $2,282.25 | $3,098.71 | $3,533.84 |
K-12 textbooks during Covid-19
- During March 2020, the peak of the Covid-19 lockdowns, around 50% of Amazon’s best-selling print titles were K-12 educational and activity books.
- Educational publishers also benefited from the lockdowns, as Scholastic reported an increase of 70% compared to 2019 for workbook sales.
- There was a huge interest in investing in online education during this period, and venture capitalists invested around $16 billion in online education technologies in 2020,
- This was over 2x more than the previous record in 2018 ($8.2 billion).
College
Over 19 million students enroll in US colleges yearly in over 5,300 colleges and universities. While the number of US students has declined by 9.6% since 2010, higher education still plays a significant role in the publishing industry.
We compiled a report on the most interesting statistics about the higher-ed book industry and its changes over the years.
College textbook sales by year
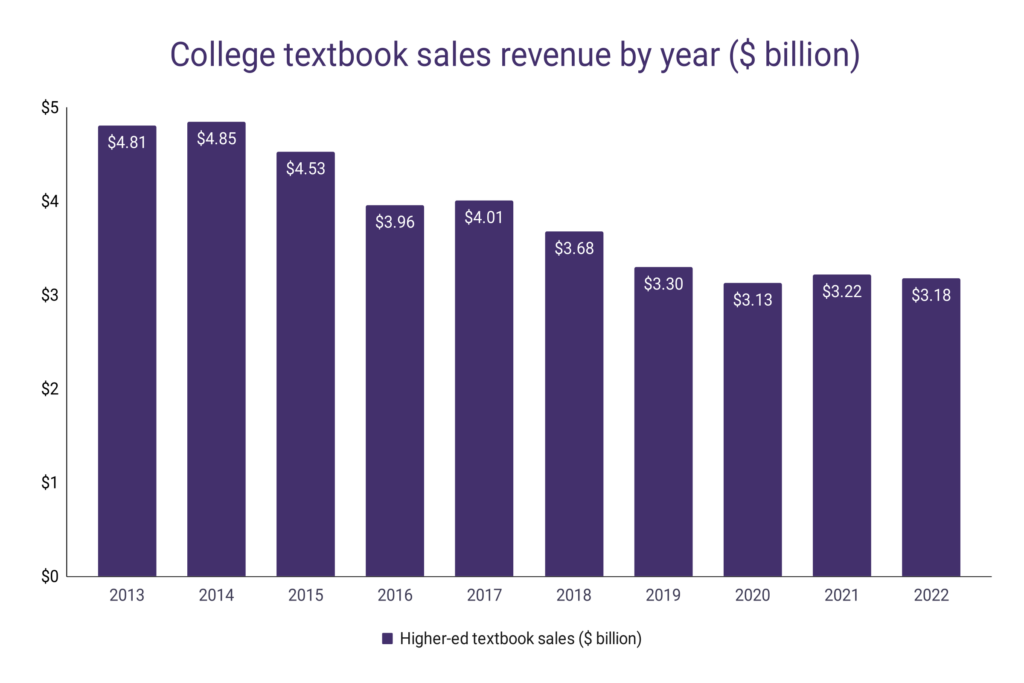
- In 2022, higher-ed textbook sales in the United States generated over $3.18 billion in revenue.
- With a decline of 1.24% over 2021, the college textbook revenue in 2022 was the lowest annual revenue of this category over the last 9 years, excluding the pandemic-affected 2020.
- Overall, college textbook sales are down by over 34.94% compared to 2013, while the educational industry is up 1.62% over the same period.
- At the same time, the publishing industry overall has grown by 8.35% since 2013.
- This means that the higher-ed segment was the main reason behind the slower growth of educational book sales over the last decade.
| Year | Higher-ed textbook sales ($ billion) | Growth |
| 2013 | $4.81 | |
| 2014 | $4.85 | 0.83% |
| 2015 | $4.53 | -6.60% |
| 2016 | $3.96 | -12.58% |
| 2017 | $4.01 | 1.26% |
| 2018 | $3.68 | -8.23% |
| 2019 | $3.30 | -10.33% |
| 2020 | $3.13 | -5.15% |
| 2021 | $3.22 | 2.88% |
| 2022 | $3.18 | -1.24% |
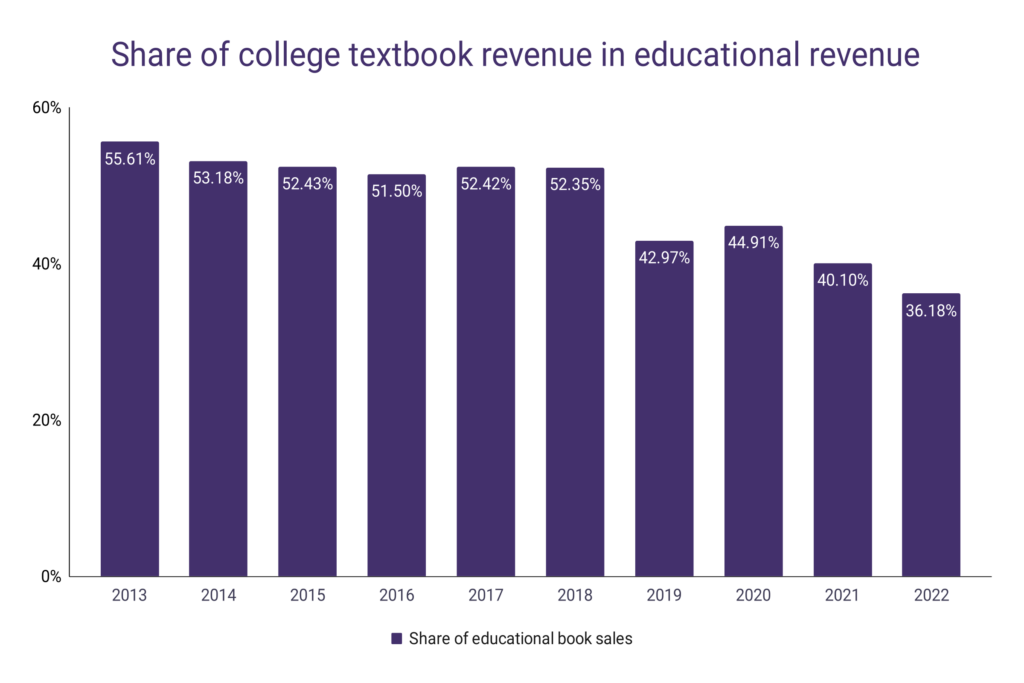
College textbooks were the dominant revenue source for the educational industry until 2019, when the preK-12 segment took over:
- In 2022, higher-ed textbooks accounted for 36.18% of the educational book sales revenue in the United States.
- Only 4 years ago, in 2018, college textbooks accounted for over 52.3% of the industry’s revenue.
- In 2013, this segment controlled over 55.6% of the educational publishing market.
- Over the last 9 years, college textbooks’ share in the educational revenue has declined by over 34.94%.
- In 2022, college textbooks generated over $1.63 billion less than in 2013.
| Year | Higher-ed textbook sales ($ billion) | Educational books revenue ($ billion) | Share of educational book sales |
| 2013 | $4.81 | $8.65 | 55.61% |
| 2014 | $4.85 | $9.12 | 53.18% |
| 2015 | $4.53 | $8.64 | 52.43% |
| 2016 | $3.96 | $7.69 | 51.50% |
| 2017 | $4.01 | $7.65 | 52.42% |
| 2018 | $3.68 | $7.03 | 52.35% |
| 2019 | $3.30 | $7.68 | 42.97% |
| 2020 | $3.13 | $6.97 | 44.91% |
| 2021 | $3.22 | $8.03 | 40.10% |
| 2022 | $3.18 | $8.79 | 36.18% |
| Growth since 2013 | -33.89% | 1.62% | -34.94% |
The average price of college textbooks
While college expenses for the average US student, including tuition fees, are presenting a huge challenge for most students, the price of college books actually declined over the last few years:
- As of 2022, the average newly printed college textbook costs around $105.37.
- Considering the revenue from college book publishing, we can roughly estimate that over 29.42 million copies of college textbooks are sold during the year.
- The same estimation can suggest that the average US student will purchase only 2 newly-published textbooks during the year while seeking the rest on the second-hand or a digital book market.
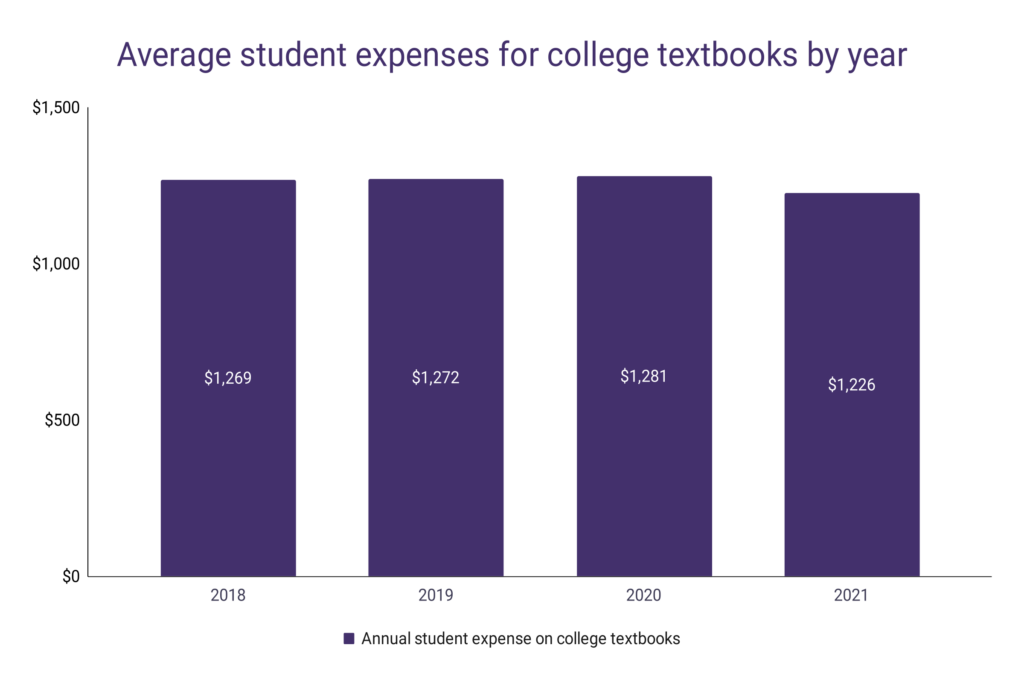
- At the same time, the average US college student (in a public university) spends around $1,226 on textbooks.
- The average price of college textbooks is on a decline – dropping from $1,269 in 2018.
| Year | Annual student expenses on college textbooks | Change |
| 2018 | $1,269 | |
| 2019 | $1,272 | 0.24% |
| 2020 | $1,281 | 0.71% |
| 2021 | $1,226 | -4.29% |
- Overall, college textbook prices have been growing at a slower rate compared to the US industry average.
- Since 2013, the Consumer Price Index for college textbooks (CPI) has grown by 21.9%, while the overall CPI in the United States grew by 25.6%.
- From 2013 to 2018, college textbook prices grew by 20.29%, while overall prices in the US (measured through CPI) grew by 7.8%.
- Since 2019, the situation has been the opposite – college textbooks grew by only 3.8%, and the industry became 14.47% more expensive overall.
| Year | College textbooks CPI | CPI in the US |
| 2013 | 101.75 | 101.16 |
| 2014 | 105.73 | 102.80 |
| 2015 | 111.98 | 102.93 |
| 2016 | 118.15 | 104.22 |
| 2017 | 121.24 | 106.44 |
| 2018 | 122.39 | 109.04 |
| 2019 | 119.50 | 111.02 |
| 2020 | 117.66 | 112.39 |
| 2021 | 118.82 | 117.67 |
| 2022 | 124.05 | 127.09 |
| Change from 2013 to 2018 | 20.29% | 7.79% |
| Change from 2019 to 2022 | 3.80% | 14.47% |

- Over 29.7% of US public university students used some kind of financial aid to buy college textbooks.
- College ebooks are on the rise, as the spending on digital textbooks has increased by more than 156% over the last 10 years.
- Additionally, over 63% of students have skipped buying at least one required college textbook.
- At the same time, over one-third of college professors don’t know the real price of textbooks required for their classes when they choose them.
- Each new edition of a college textbook is over 12% more expensive than the previous one.
- Over 12% of Latinx college students fail a class because they weren’t able to buy textbooks, as opposed to only 5% of caucasian students.