This report analyzed the most recent statistics addressing the number of Latino and Hispanic writers and authors in the US, as well as historical trends regarding their impact on the writing community in the country.
We’ll also look into the latest CCBC data on children’s picture book authors and how big of a role Latino and Hispanic writers play in this category, with a deeper dive into gender distribution.
How many Latino and Hispanic authors are in the US?
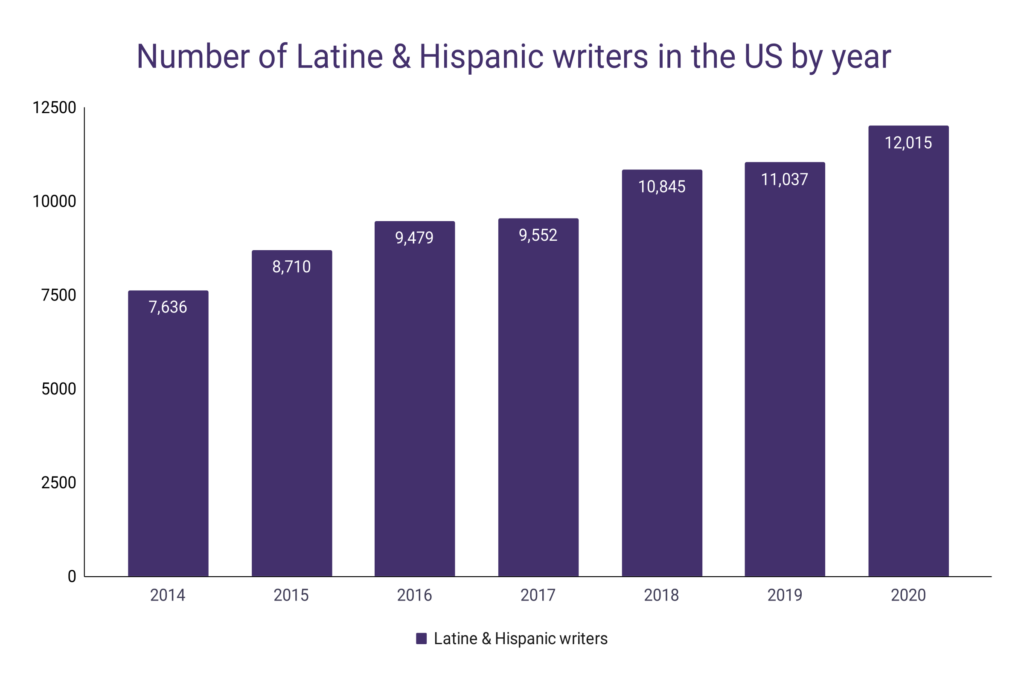
There are around 12,015 writers of Latine & Hispanic origin in the United States as of 2020.
The number of Latino & Hispanic writers increased by 8.86% since 2019, jumping from 11,037.
There have been over 10,000 Latino & Hispanic writers in the US for 3 years in a row, starting from 2018.
This group has been increasing in numbers every year since 2014, at least.
Overall, the number of Latino & Hispanic writers has increased by 57.35% since 2014, making them the fastest-growing ethnic group of writers in the United States over this period.
Year
Latino & Hispanic writers in the US
Change
2020
12,015
8.86%
2019
11,037
1.77%
2018
10,845
13.54%
2017
9,552
0.77%
2016
9,479
8.83%
2015
8,710
14.06%
2014
7,636
Since 2014
57.35%
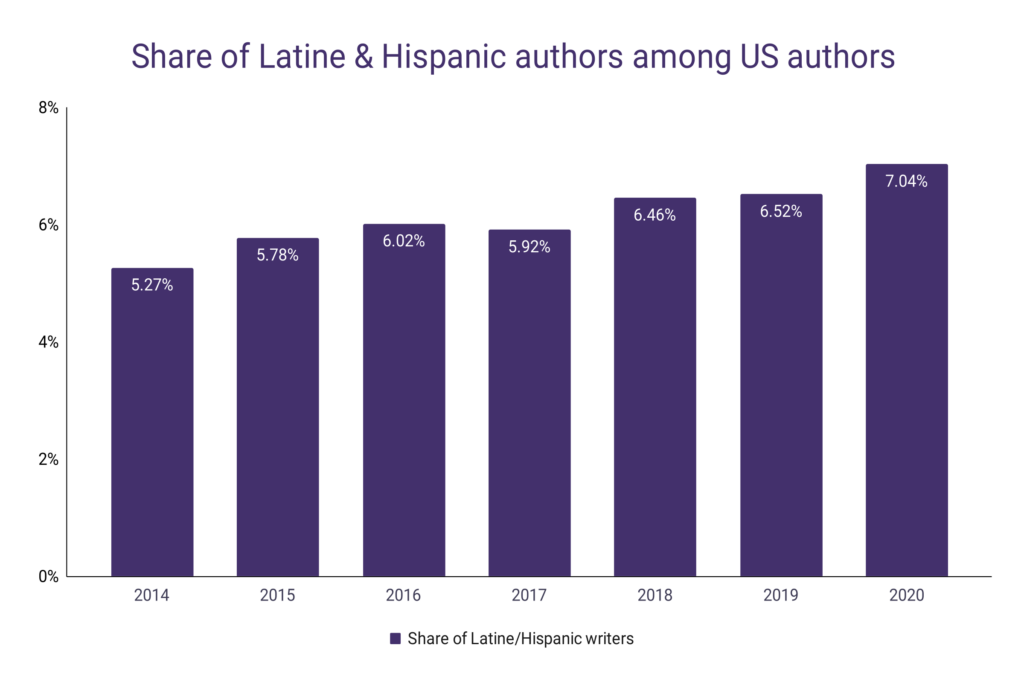
As of 2020, over 7.04% of all authors in the United States are of Latino & Hispanic origin.
This group increased its share in the US writers’ community by 7.88% compared to 2019.
Since 2014, Latino & Hispanic authors have increased their share among US authors by 33.60%, the biggest gain among all ethnic groups.
Latino & Hispanic authors are the biggest minority authors group in the United States as of 2020.
Year
Share of Latino/Hispanic writers among US authors
Change
2020
7.04%
7.88%
2019
6.52%
0.97%
2018
6.46%
9.17%
2017
5.92%
-1.68%
2016
6.02%
4.17%
2015
5.78%
9.70%
2014
5.27%
Since 2014
33.60%
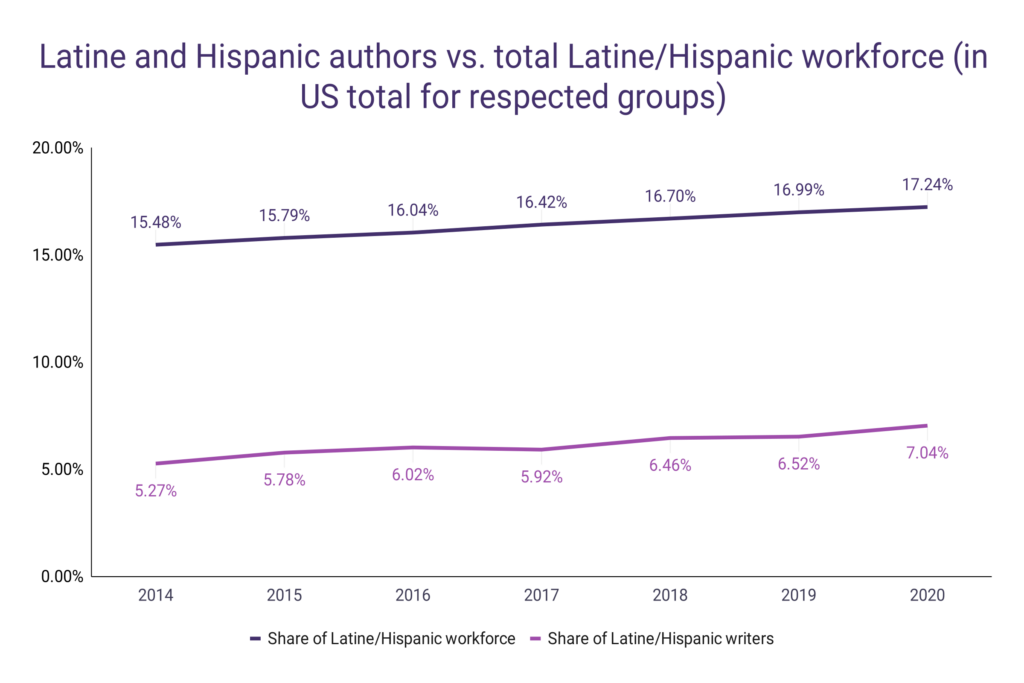
Over 25.5 million people of Latino & Hispanic origin are eligible for work in the United States, accounting for 17.24% of the US workforce as of 2020.
However, only 7.04% of authors in writers in US are of Hispanic & Latino origin, meaning that the average US citizen of this origin in less than 2x less likely to be a writer compared to the average US citizen.
Since 2014, the share of Hispanic people in the US workforce has increased by 11.36%, while the share of Hispanic writers and authors among all US writers has increased by 33.60%.
This shows a positive trend in the representation of Latino & Hispanic writers in the US writing community, even though we’re still far from equality that matches the size of Latino workforces in the States.
Year
Share of Latino/Hispanic workforce
Change
Share of Latino/Hispanic writers
Change
2020
17.24%
1.44%
7.04%
7.88%
2019
16.99%
1.76%
6.52%
0.97%
2018
16.70%
1.72%
6.46%
9.17%
2017
16.42%
2.31%
5.92%
-1.68%
2016
16.04%
1.58%
6.02%
4.17%
2015
15.79%
2.05%
5.78%
9.70%
2014
15.48%
5.27%
Since 2014
11.36%
33.60%
WordsRated tracks the representation of Hispanic and Latino authors in publishing and also builds free word game tools. Try unscrambling words with our free tool, use our Wordle Solver for daily Wordle help, check hints for today’s Connections, or test yourself with today’s Mini Crossword Hint if you like a quick crossword.
How many Latino & Hispanic children’s authors are in the US?
We analyzed the database of children’s and young adult picture books, regularly updated by CCBC, to look at how the number and share of Hispanic & Latino authors changed over the last several years. This report is the extension of our study on picture book characters published last year.
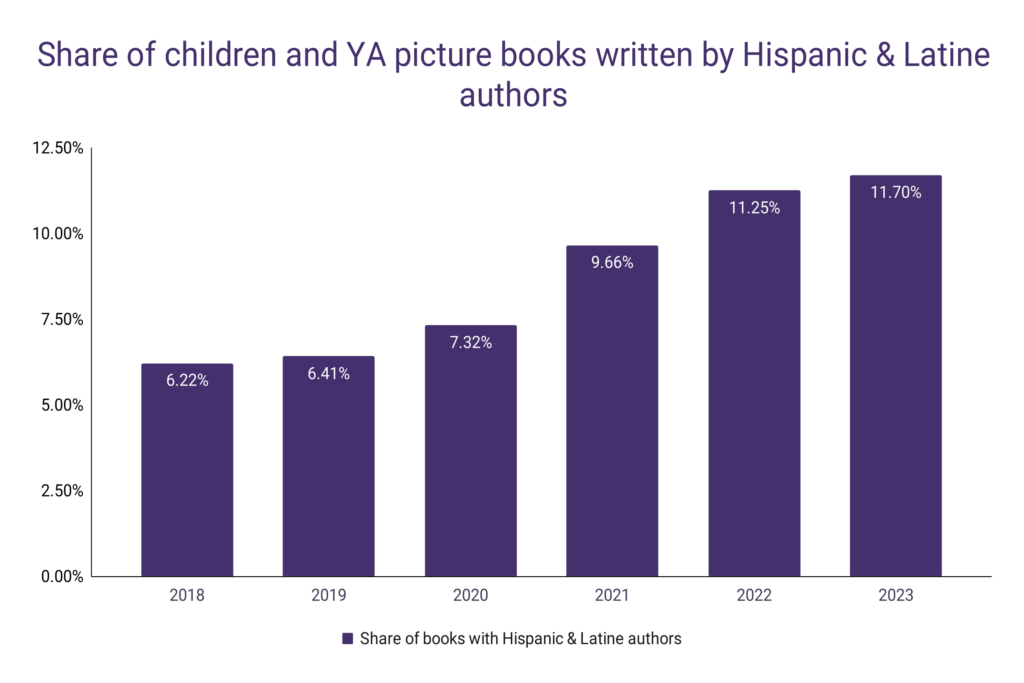
As of 2023, over 11.70% of all children’s and YA picture books have at least one Latino and Hispanic author and illustrator.
This is a 4% increase over 2022, then over 9.47% of all analyzed books had an author of Latino & Hispanic origin.
In 2018, this number was much lower, as Hispanic and Latino authors accounted for only 6.22% of picture books published over the year.
Overall, since 2018, the share of picture books featuring at least one Latino or Hispanic author has increased by 88%.
Latino & Hispanic authors are the second most frequent minority group in children and YA picture book category, after Black authors.
Year
Share of books with Hispanic & Latino authors
Change
2023
11.70%
4%
2022
11.25%
16%
2021
9.66%
32%
2020
7.32%
14%
2019
6.41%
3%
2018
6.22%
Since 2018
88%
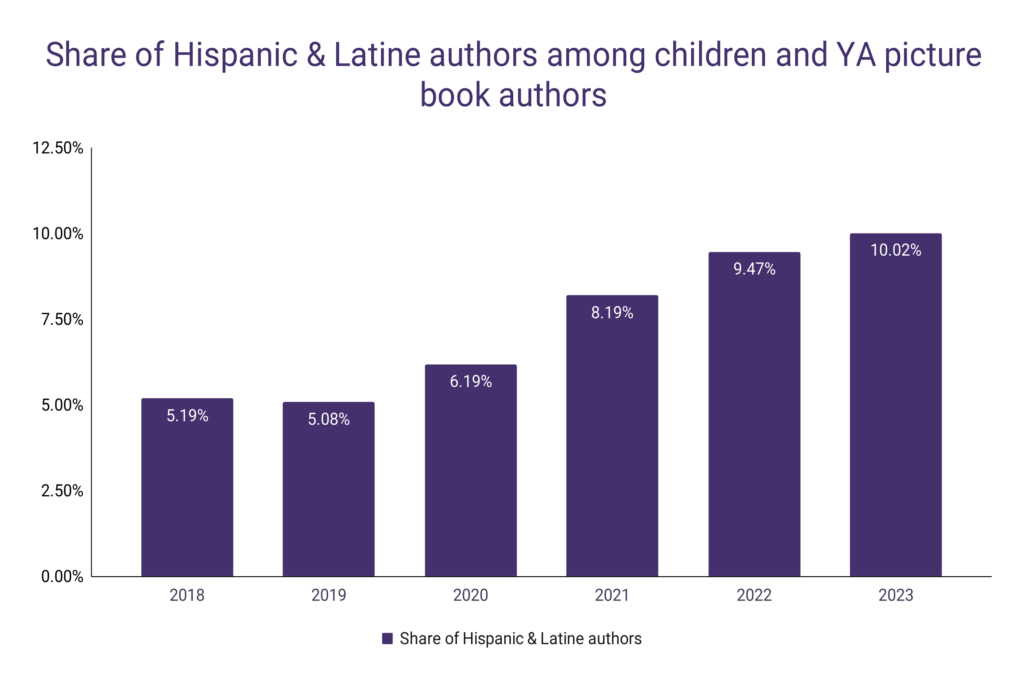
Among all authors and illustrators listed in children’s and YA picture books for 2023, Hispanic & Latino authors account for 10.02% of the group.
This presents a 6% increase compared to 2022 figures when Latino and Hispanic authors presented 9.47% of all authors and illustrators of picture books.
In 2019, this number was as low as 5.08%, meaning that the share of Latino authors among picture book authors has nearly doubled over the last 4 years.
Since 2018, the share of Latino & Hispanic authors among children’s and YA picture book authors increased by 93%.
Year
Share of Hispanic & Latino authors
Change
2023
10.02%
6%
2022
9.47%
16%
2021
8.19%
32%
2020
6.19%
22%
2019
5.08%
-2%
2018
5.19%
Since 2018
93%
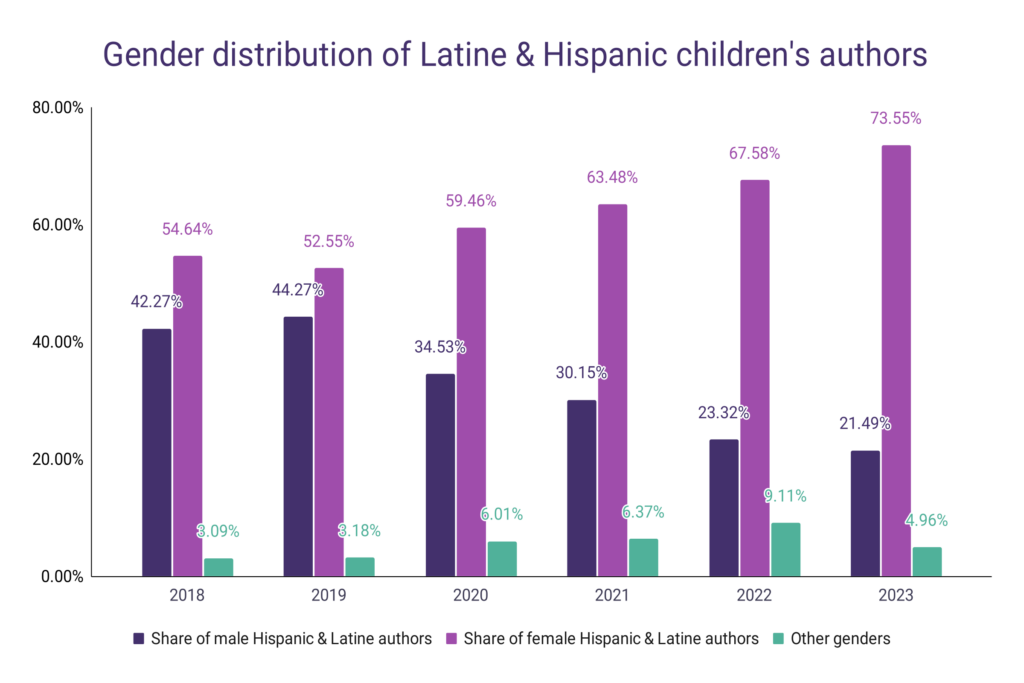
Among Latino & Hispanic children writers, females account for 73.55% as of 2023, a jump from 67.58% in 2022.
Male Hispanic & Latino authors account for 21.49% of all authors from this group as of 2023, and authors of other genders account for 4.96%.
Over the last 5 years, female authors increased their share among Latina and Hispanic authors by 35%, jumping from 54.64% in 2018.
During the same period, male authors went from 42.27% in 2018 to 21.49% in 2023, which presents a 49% decrease.
Authors of other genders accounted for 3.09% of all Latino & Hispanic authors in 2018, and increased by 60% by 2023.