

How many people visit US public libraries?
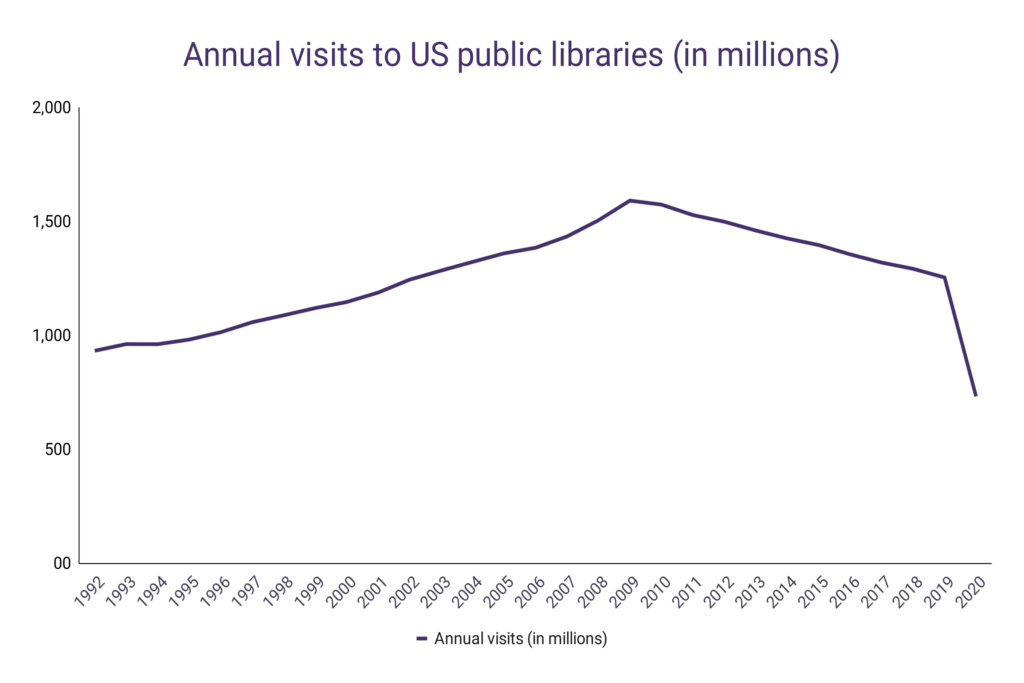
When it comes to the book industry, the general trend is a migration toward the online experience, whether it’s book sales or looking for a book to buy. Libraries are not immune to this trend, as fewer and fewer people visit the US public libraries every year:
- Around 732.36 million Americans visited a public library in 2020, which was heavily impacted by the pandemic. These visits include attendance to library programs as well.
- Library visits in 2020 dropped by 41.6% compared to 2019, when over 1.25 billion people visited public libraries.
- Even before the pandemic, there was a clear negative trend in US public library visits – they have been declining every year since 2010.
- Before 2010, library visits had been rising for 15 consecutive years by 3.2% on average.
| Year | Annual visits (in millions) | Change |
| 2020 | 732.36 | -41.60% |
| 2019 | 1,254.04 | -2.95% |
| 2018 | 1,292.10 | -2.08% |
| 2017 | 1,319.55 | -2.65% |
| 2016 | 1,355.51 | -2.93% |
| 2015 | 1,396.46 | -2.03% |
| 2014 | 1,425.33 | -2.39% |
| 2013 | 1,460.20 | -2.58% |
| 2012 | 1,498.89 | -1.91% |
| 2011 | 1,528.15 | -2.91% |
| 2010 | 1,574.02 | -1.09% |
| 2009 | 1,591.29 | 5.74% |
| 2008 | 1,504.86 | 4.96% |
| 2007 | 1,433.73 | 3.57% |
| 2006 | 1,384.37 | 1.80% |
| 2005 | 1,359.86 | 2.83% |
| 2004 | 1,322.40 | 2.98% |
| 2003 | 1,284.18 | 3.20% |
| 2002 | 1,244.35 | 4.77% |
| 2001 | 1,187.72 | 3.62% |
| 2000 | 1,146.28 | 2.37% |
| 1999 | 1,119.73 | 2.91% |
| 1998 | 1,088.03 | 2.86% |
| 1997 | 1,057.78 | 4.34% |
| 1996 | 1,013.80 | 3.28% |
| 1995 | 981.57 | 2.11% |
| 1994 | 961.27 | -0.05% |
| 1993 | 961.79 | 3.15% |
| 1992 | 932.44 |
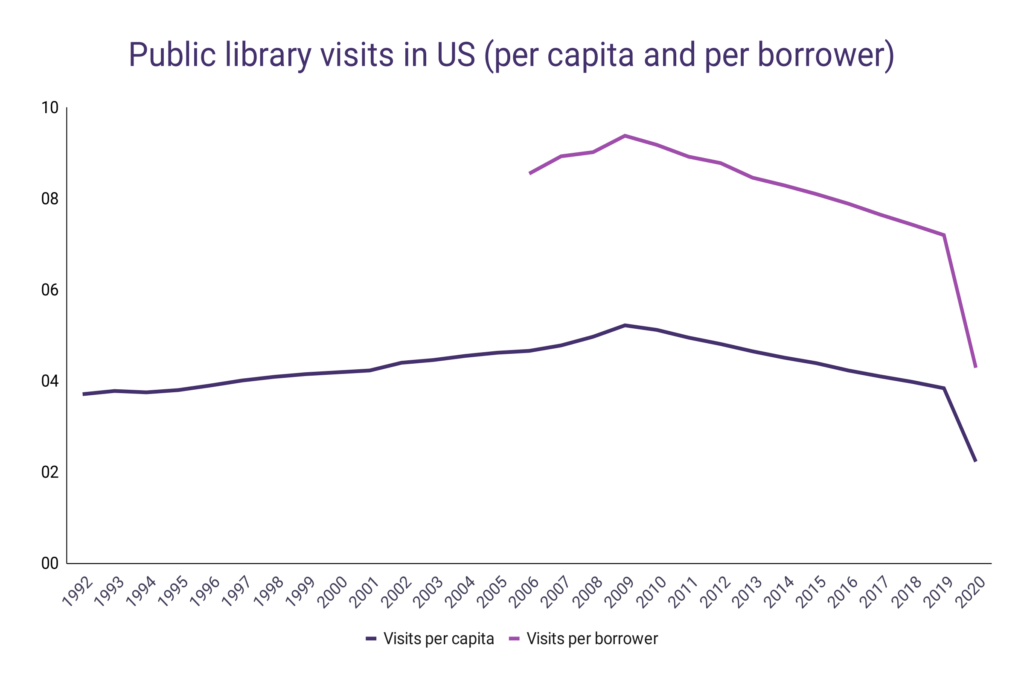
While library visits declined over the years, the US population has grown. This means that per-capita visits went down as well:
- In 2020, the average US citizen visited a public library on 2.23 occasions which is 41.9% lower compared to 3.84 visits in 2019.
- Since this record has been measured, library visits in 2020 were at the historical minimum.
- Per-capita public library visits peaked in 2009 when the average American went to the library on 5.22 occasions.
- During 2020, the average library member visited a public library in the US on 4.29 occasions.
- Library visits per member have also been on the decline since 2010, after peaking at 9.28 visits in 2009.
| Year | Visits per capita | Change | Visits per borrower | Change |
| 2020 | 2.23 | -41.93% | 4.29 | -40.42% |
| 2019 | 3.84 | -3.52% | 7.2 | -3.10% |
| 2018 | 3.98 | -2.93% | 7.43 | -2.88% |
| 2017 | 4.1 | -3.07% | 7.65 | -3.04% |
| 2016 | 4.23 | -3.64% | 7.89 | -2.59% |
| 2015 | 4.39 | -2.66% | 8.1 | -2.29% |
| 2014 | 4.51 | -3.01% | 8.29 | -2.01% |
| 2013 | 4.65 | -3.33% | 8.46 | -3.64% |
| 2012 | 4.81 | -2.83% | 8.78 | -1.57% |
| 2011 | 4.95 | -3.32% | 8.92 | -2.83% |
| 2010 | 5.12 | -1.92% | 9.18 | -2.13% |
| 2009 | 5.22 | 5.03% | 9.38 | 3.99% |
| 2008 | 4.97 | 3.97% | 9.02 | 1.01% |
| 2007 | 4.78 | 2.58% | 8.93 | 4.44% |
| 2006 | 4.66 | 0.87% | 8.55 | |
| 2005 | 4.62 | 1.54% | ||
| 2004 | 4.55 | 2.02% | ||
| 2003 | 4.46 | 1.36% | ||
| 2002 | 4.4 | 4.02% | ||
| 2001 | 4.23 | 0.95% | ||
| 2000 | 4.19 | 0.96% | ||
| 1999 | 4.15 | 1.47% | ||
| 1998 | 4.09 | 2.00% | ||
| 1997 | 4.01 | 2.82% | ||
| 1996 | 3.9 | 2.63% | ||
| 1995 | 3.8 | 1.33% | ||
| 1994 | 3.75 | -0.79% | ||
| 1993 | 3.78 | 1.89% | ||
| 1992 | 3.71 |
Library visits by state
- With over 95.82 million citizens visiting its local libraries, California leads all US states when it comes to annual library visits.
- California has more library visits than the next two states on the list combined – Illinois is second with 50.15 million visits, and Ohio is third with 44.22 million.
- 8 states with the most library visits account for 50% of all US public libraries visits.
- On the other side of the spectrum, North Dacota has only 912 thousand visits to its libraries during a year and is the only US state with less than 1 million public library visits.
- Looking at visits per capita, Vermont leads all the states with 4.02 public library visits per capita in 2020.
- Mississippi has the lowest record of per-capita library visits, with 1.17.
- Illinois’ library borrowers visit their libraries on 10.84 occasions during a year, on average. This is the most among all US states.
| State | Annual library visits | Visits per capita | Visits per borrower |
| California | 95,821,437 | 2.41 | 4.09 |
| Illinois | 50,159,232 | 3.96 | 10.84 |
| Ohio | 44,225,213 | 3.84 | 5.61 |
| New York | 37,763,326 | 1.95 | 3.66 |
| Texas | 35,191,610 | 1.21 | 2.42 |
| Florida | 34,862,119 | 1.61 | 3.04 |
| Michigan | 33,880,114 | 3.39 | 7.86 |
| Massachusetts | 26,967,040 | 3.91 | 7.13 |
| Virginia | 23,266,470 | 2.71 | 4.84 |
| North Carolina | 21,615,878 | 2.06 | 3.71 |
| Missouri | 19,758,877 | 3.23 | 5.97 |
| Georgia | 18,209,721 | 1.68 | 4.17 |
| Maryland | 17,483,983 | 2.89 | 5.55 |
| Pennsylvania | 16,920,514 | 1.33 | 3.32 |
| Arizona | 16,665,171 | 2.28 | 5.3 |
| Connecticut | 14,204,846 | 3.98 | 9.42 |
| Oregon | 13,501,598 | 3.19 | 6.36 |
| New Jersey | 13,375,081 | 1.52 | 3.4 |
| Tennessee | 12,990,646 | 1.9 | 4.19 |
| Indiana | 12,760,976 | 1.97 | 4.66 |
| Wisconsin | 12,743,232 | 2.18 | 4.33 |
| Iowa | 11,854,428 | 3.76 | 6.18 |
| Kentucky | 11,430,998 | 2.55 | 4.45 |
| South Carolina | 10,165,262 | 2.18 | 4 |
| Washington | 9,749,970 | 1.27 | 2.44 |
| Oklahoma | 9,563,212 | 2.42 | 5.24 |
| Colorado | 9,320,267 | 1.62 | 2.56 |
| Utah | 8,589,522 | 2.68 | 4.82 |
| Alabama | 7,959,151 | 1.63 | 3.16 |
| Minnesota | 7,863,564 | 1.38 | 2.25 |
| Nevada | 6,858,254 | 2.2 | 5.12 |
| Louisiana | 6,634,013 | 1.43 | 2.78 |
| Kansas | 5,433,344 | 1.87 | 1.65 |
| New Mexico | 4,679,185 | 2.27 | 4 |
| Idaho | 4,533,303 | 2.54 | 5.59 |
| Arkansas | 4,058,477 | 1.36 | 2.37 |
| Maine | 3,964,950 | 2.94 | 6.23 |
| Rhode Island | 3,701,021 | 3.52 | 9.78 |
| Nebraska | 3,613,263 | 1.87 | 3.39 |
| Mississippi | 3,494,007 | 1.17 | 2.25 |
| New Hampshire | 3,458,789 | 2.51 | 4.86 |
| West Virginia | 3,250,156 | 1.75 | 3.12 |
| Montana | 2,982,245 | 3.02 | 7.18 |
| Delaware | 2,744,471 | 2.82 | 8.7 |
| Hawaii | 2,597,672 | 1.83 | 2.54 |
| Vermont | 2,506,720 | 4.02 | 7.72 |
| Alaska | 2,480,271 | 3.4 | 7.18 |
| Wyoming | 2,257,827 | 3.9 | 6.59 |
| District of Columbia | 1,852,701 | 2.69 | 4.47 |
| South Dakota | 1,480,357 | 1.67 | 4.18 |
| North Dakota | 912,480 | 1.2 | 3.7 |
Library visits are driven by a love of reading and learning, the same impulse that makes daily word games so appealing. WordsRated publishes hints for today’s Connections and today’s Wordle every day, and our Word Finder helps find words from any set of letters. For fans of NYT Strands, the Strands Archive archives every past puzzle.
Online library visits
While physical visits to libraries are declining, online visits are on the rise. However, the pandemic affected even this segment of libraries, and online visits dropped for the first time compared to the previous year in 2020.
- US public libraries recorded over 1.16 billion visits to their websites in 2020.
- This was a 20% drop compared to 2019 when libraries recorded over 1.46 billion website visits.
- During the last pre-pandemic year, library website visits jumped by 31.9%.
- The average US citizen visited their local library’s website on 3.54 occasions during 2020, 4.49 times in 2019, and 3.42 times in 2018.
- The average library member visited their library’s website 6.79 times in 2020 and 8.41 times in 2019.
- Massachusetts has by far the most library website visits in the US, with 122.74 million as of 2020, or 17.8 visits per capita.
- On the other hand, Mississippi (0.77), North Dakota (0.91), and Wyoming (0.94) are the only US states with less than 1 website visitorsors to the library per capita annually.