Open access academic journals and articles have been on the rise over the past couple of decades. The market for open access publishing is worth around $1.6 billion as of 2021, accounting for around 15% of the academic article publishing market.
However, more than 50% of all academic articles have some form of open access, and this number is increasing every year. This report analyzes the evolution of open access publishing over the past few decades and how prominent is the role of open access articles today.
How many open access academic papers are published each year?
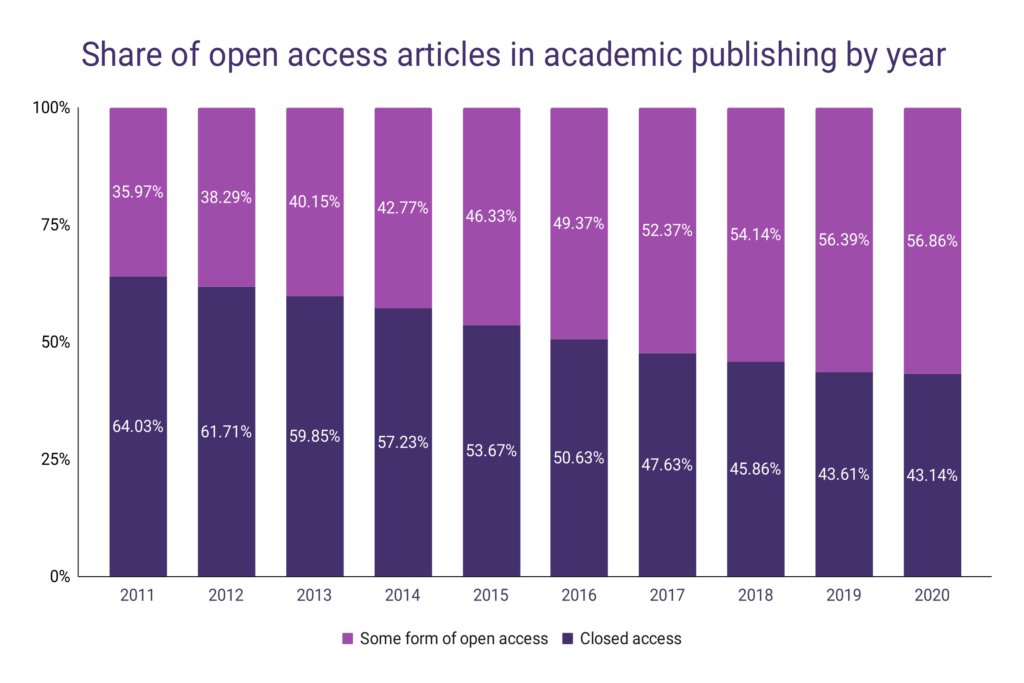
Over 56.86% of academic articles published during 2020 have some form of open access. Articles with open access accounted for over half of all published articles for the third year in a row.
The share of articles with any form of open access increased by 58% over the last 10 years and by 78% since the start of the 21st century.
The average growth rate of open access articles since 2011 stands at 4.69%, while the average growth since 2000 is 4.66%.
However, during 2020, the share of open access articles published over the year grew by only 1%, which was the slowest growth since 2006.
On the other hand, articles with closed access account for 43.14% of all published articles during 2020; 10 years ago, this share was 64.03%, and in 2000 over 78.17% of published articles for the year had closed access.
The share of fully closed access articles dropped by 33% over the past 10 years and by more than 45% since the beginning of the 21st century.
Closed access articles had a negative CAGR of 2.79% annually since 2000 and 3.87% since 2011 when it comes to their share in all published academic articles over the year.
Year
Some form of open access
Closed access
2020
56.86%
43.14%
2019
56.39%
43.61%
2018
54.14%
45.86%
2017
52.37%
47.63%
2016
49.37%
50.63%
2015
46.33%
53.67%
2014
42.77%
57.23%
2013
40.15%
59.85%
2012
38.29%
61.71%
2011
35.97%
64.03%
2010
31.61%
68.39%
2009
31.02%
68.98%
2008
29.69%
70.31%
2007
27.53%
72.47%
2006
26.18%
73.82%
2005
26.11%
73.89%
2004
24.69%
75.31%
2003
24.42%
75.58%
2002
24.24%
75.76%
2001
22.28%
77.72%
2000
21.83%
78.17%
When it comes to academic articles with fully-opened access, or gold open access articles, the growth is even more drastic:
During 2020, over 35.98% of all published academic articles had fully opened access without any restrictions or additional fees required.
This was a 7% increase compared to the previous year when 33.76% of all published articles over the year were completely free of charge.
Over the past 10 years, the share of fully opened access academic articles increased by more than 244%, jumping from 10.44% in 2011.
Since the start of the 21st century, the share of academic articles with no fees whatsoever increased by more than 14 times, from 2.38% in 2000 to 35.87% in 2020.
Green access academic articles, where readers are charged on the publishers page, accounted for 4.74% of all published articles in 2020. Their share in academic publishing dropped by 43% over the past 10 years.
Bronze open access articles, which are free to read but are not accompanied by a license, accounted for 9.95% of all published academic articles during 2020.
Hybrid-access academic articles, free under an open-access license in a journal with paid access, accounted for 6.19% of all published articles in 2020.
The share of hybrid articles in academic publishing increased by 73% over the past 10 years and by more than 355% since 2000.
Year
Fully open access (Gold)
Green
Bronze
Hybrid
Closed access
2020
35.98%
4.74%
9.95%
6.19%
43.14%
2019
33.76%
6.34%
11.20%
5.09%
43.61%
2018
29.35%
7.34%
12.30%
5.15%
45.86%
2017
26.03%
7.77%
13.17%
5.40%
47.63%
2016
22.25%
7.91%
13.82%
5.39%
50.63%
2015
20.01%
7.83%
13.40%
5.10%
53.67%
2014
16.68%
7.99%
13.27%
4.83%
57.23%
2013
14.04%
8.26%
13.45%
4.39%
59.85%
2012
12.60%
8.11%
13.66%
3.91%
61.71%
2011
10.44%
8.27%
13.68%
3.58%
64.03%
2010
8.21%
7.77%
12.81%
2.82%
68.39%
2009
7.01%
8.14%
13.07%
2.79%
68.98%
2008
6.15%
7.77%
13.18%
2.59%
70.31%
2007
4.83%
7.06%
13.36%
2.28%
72.47%
2006
4.39%
6.57%
13.49%
1.73%
73.82%
2005
4.08%
6.10%
14.11%
1.82%
73.89%
2004
3.41%
5.49%
14.01%
1.79%
75.31%
2003
2.98%
5.29%
14.37%
1.78%
75.58%
2002
2.85%
4.93%
14.81%
1.65%
75.76%
2001
2.51%
4.65%
13.64%
1.49%
77.72%
2000
2.38%
4.48%
13.61%
1.36%
78.17%
Which university published the most open access articles?
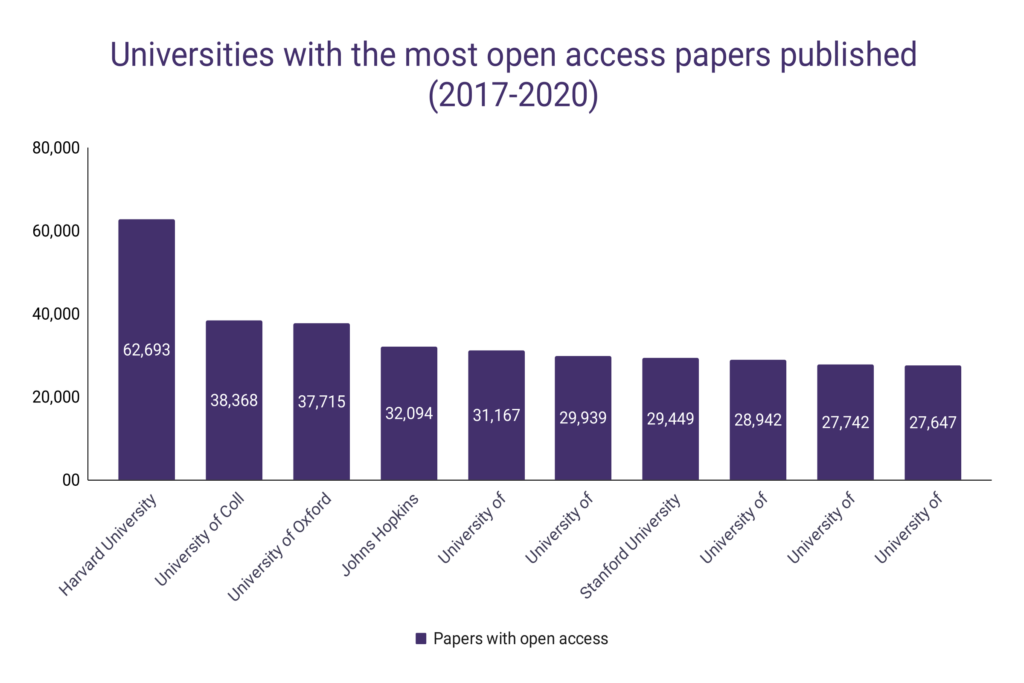
Harvard University published over 62,693 articles with open access between 2017 and 2020, the most among all universities worldwide.
The University of Coll London produced the second-most open access academic articles, around 38,368, followed by the University of Oxford with 37,715.
Johns Hopkins University (32,094) and the University of Cambridge (31,167) are the only remaining universities with over 30,000 open access papers published over 4 years.
Over 151 universities worldwide published over 10,000 open access documents between 2017 and 2020, and 33 published over 20,000.
The average university published around 4,393 open access papers over the past 4 years.
Rank
University
Country
Total papers published
Papers with open access
Share of papers with open access
1
Harvard University
United States
86,342
62,693
72.61%
2
University of Coll London
United Kingdom
42,702
38,368
89.85%
3
University of Oxford
United Kingdom
43,264
37,715
87.17%
4
Johns Hopkins University
United States
44,779
32,094
71.67%
5
University of Cambridge
United Kingdom
36,473
31,167
85.45%
6
University of Michigan
United States
43,672
29,939
68.55%
7
Stanford University
United States
42,339
29,449
69.56%
8
University of Chinese Acad Sci
China
77,003
28,942
37.59%
9
University of Washington – Seattle
United States
39,461
27,742
70.30%
10
University of Toronto
Canada
50,085
27,647
55.20%
11
Imperial Coll London
United Kingdom
34,077
26,102
76.60%
12
Sorbonne University
France
31,952
25,241
79.00%
13
Duke University
United States
35,313
24,636
69.76%
14
University of California – Los Angeles
United States
35,629
24,462
68.66%
15
University of Penn
United States
35,036
24,011
68.53%
16
Columbia University
United States
34,527
23,952
69.37%
17
MIT
United States
29,958
23,680
79.04%
18
University of California – San Diego
United States
31,700
23,638
74.57%
19
University of Melbourne
Australia
35,631
23,234
65.21%
20
Shanghai Jiao Tong University
China
51,060
22,594
44.25%
When it comes to the share of published papers with open access, The London School of Hygiene & Tropical Medicine published over 93.99% of its academic papers through open access, the most among any university worldwide, with over 1,000 articles published over the year.
11 other universities published over 90% of their papers through open access between 2017 and 2020, and all of them are from the United Kingdom.
Also, 32 out of 50 universities with the biggest share of open access articles come from the UK.
Which country produces the most open access academic papers?
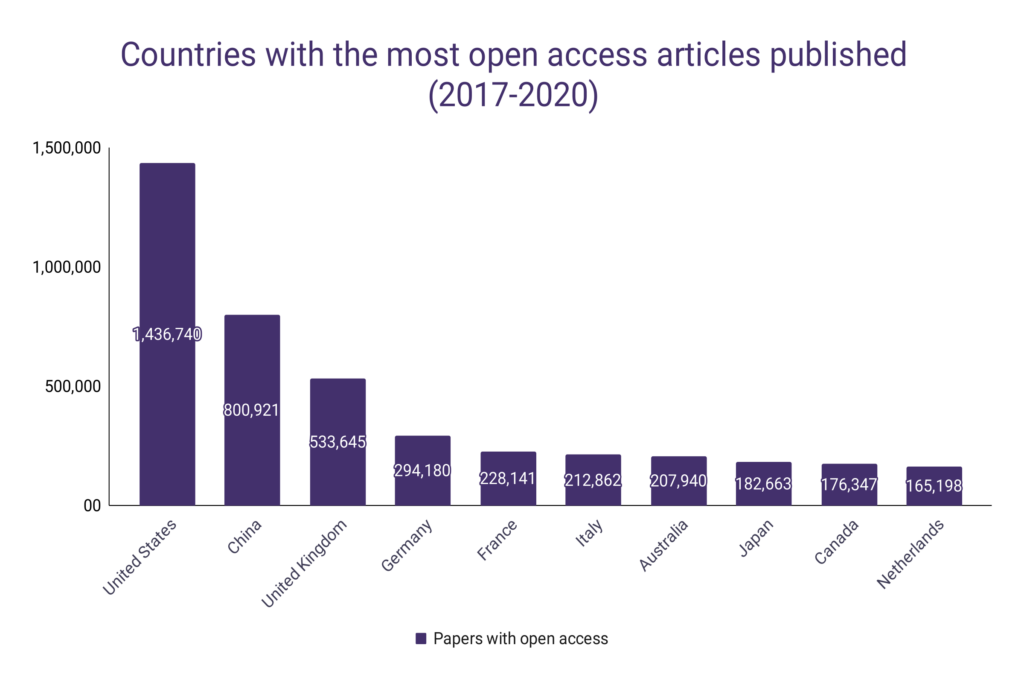
With over 1.43 million academic papers published through open access between 2017 and 2020, the United States is the leading country in the world regarding the production of open access articles.
China is in the second place with 800,921 articles published through open access over 4 years.
11 other countries published over 100,000 open access papers during this period.
When it comes to the share of academic papers available through open access, the United Kingdom is the global leader, with 86.09% of articles published in its universities available free of charge.
78.74% of academic papers published in the Netherlands between 2017 and 2000 had some form of open access, the second most worldwide.
Academic articles published in Norway had the open access share of 77.22% over this period, while Finland’s universities produced 76.34% of open access papers.
In total, 30 countries between 2017 and 2020 published more than 50% of their academic papers with some form of open access.