

Literacy rates have been shown to be a key factor in determining outcomes of everything from the likelihood of going to prison. On the other hand, the conditions a person grows up in – such as the literacy rate of their parents and poverty – have a significant impact on a child’s chances of gaining reading proficiency.
African American literacy statistics
- The number of African American adults with low literacy skills has remained relatively stable since 1992.
- The estimated literacy rate among African American adults (aged 15 and above) in the United States is approximately 88% as of 2020
- While it was around 90% for White Americans
- The overall literacy rate in the United States is around 86%, making the African American adult literacy rate slightly higher than the national average
- African American literacy rates have significantly improved over the past half-century, increasing from approximately 60% in the 1960s to the current rate of around 88%
- Factors contributing to the improvement in African American literacy rates include increased educational access, improved educational quality, and government initiatives targeting socio-economic disparities and racial inequalities
- Black Americans make up approximately 12.1% of the US population but 23% of those with poor literacy skills

| Race | % with low literacy skills | Non-American born % |
| White | 35% | 2% |
| Black | 23% | 3% |
| Hispanic | 34% | 24% |
| Other | 8% | – |
Education levels of Black or African Americans
- In 2019, approximately 84.2% of African Americans aged 25 and older held a high school diploma or higher
- The college enrollment rate for black adults aged 18-24 was 34.2% in 2020
- In 2016, African Americans with a bachelor’s degree earned 79.3% of the median income compared to their white counterparts
- Between 2008 and 2017, 23.1% of African American adults obtained a bachelor’s degree or higher
- In 2018, 69% of employed African Americans with a bachelor’s degree or higher worked in management, professional, or related occupations
- In 2016, 35.9% of African American students aged 25-29 held an associate degree or higher, while the percentage was 60.6% for white students
- The high school graduation rate within four years for African American students was 70% in 2018, whereas it was 89% for white students
African American childhood literacy statistics
- During the 2015-2016 academic year, white teachers taught 76.5% of African American students in K-12, whereas only 7% had African American teachers
- The dropout rate for African Americans aged 16-24 was 6.4% in 2018
- In 2016, 54.9% of black high school students achieved a proficient reading score, compared to 76.1% of white students
- In 2017, 26.1% of black students demonstrated proficiency in 4th-grade reading, while the percentage was 46.7% for white students
- Around 35% of African American 4-year-old children were enrolled in state-funded preschool programs in 2018
- In 2018-2019, only 10.5% of African American kindergartners met the reading readiness benchmark
- African American children represent 28% of the illiterate demographic in the United States
- The proficiency rate for African American students in 8th-grade language arts was 36.9% in 2019.
- In 2017, only 31.9% of African American students aged 3 years or older attended advanced or gifted classes, whereas the percentage was 48.6% for white students
- The national average of chronic absenteeism for African American students was 15.3% in 2017-2018, compared to 14.1% for white students
- In 2017, 61.6% of African American children aged 6-8 years had access to reading materials at home, compared to 78.8% of white children.
Covid-19 pandemic’s impact on African American students
Kindergarten readiness is a metric used to determine whether a child has developed the skills that are required to understand instructions from a kindergarten teacher and be able to carry them out. This does not necessarily mean that the students are arriving to kindergarten and can already read and write. But it does mean that the students can do things such as speak in complete sentences, play with other children, follow basic instructions.
- In the academic year 2019/20, 56% of Black students were ready for core instruction – compared to 55% of the general population
- By 2020/21, this has reduced to 30% of Black students compared to 37% of the general population
- Black students went from being slightly more ready for core instruction than the general population to being 7% less likely than the rest of the population
- Although the numbers bounced back to 42% in 2021/22 after the worst of the pandemic lockdowns, Black students are still behind the general population and behind where they were in 2019/20
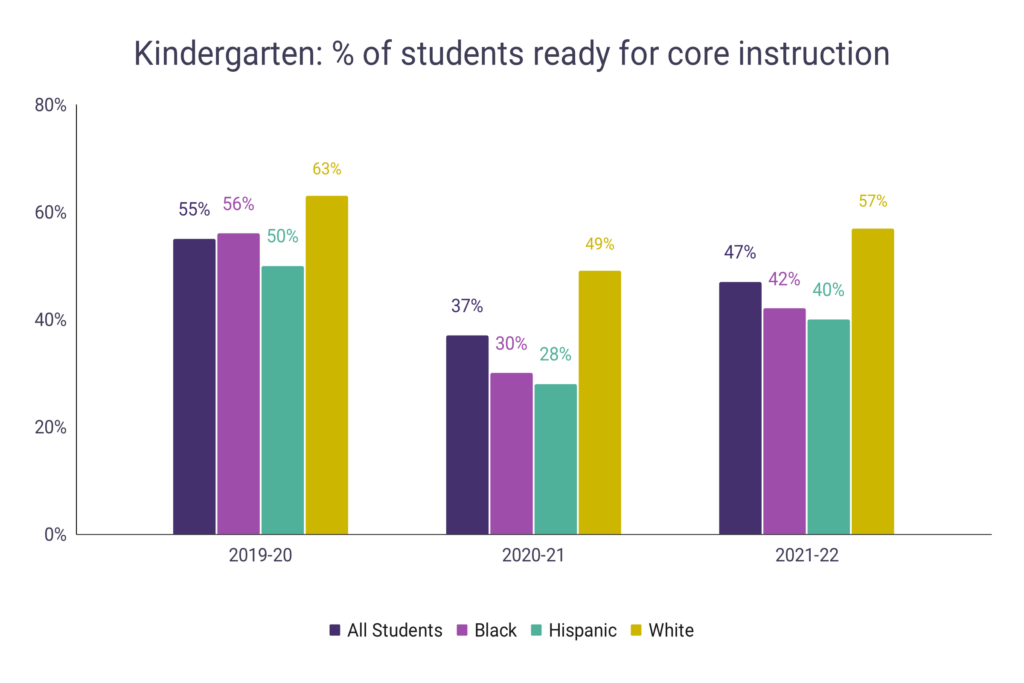
| Year | All Students | Black | Hispanic | White |
| 2019-20 | 55% | 56% | 50% | 63% |
| 2020-21 | 37% | 30% | 28% | 49% |
| 2021-22 | 47% | 42% | 40% | 57% |
Alongside our research into literacy and reading, WordsRated builds free word tools designed to help people engage with language every day. Our Word Finder and Anagram Solver are used by players, students, and teachers alike. We also publish daily hints for NYT Connections and today’s Wordle for anyone who wants a hand with the daily puzzles.