
Founded in 2016, The Athletic now operates as The New York Times’ sports department and as a stand-alone sports website available through web or app. Available to digital-subscribers only, it provides local and national coverage of a wide-range of sports, competitions and teams primarily across the US and Europe.
- The New York Times Company completed the acquisition of The Athletic Media Company on February 1, 2022 for a purchase price of $555 million.
- As of FY 2023, The Athletic made revenues of $131 million, up 54.12% over the previous year.
- The Athletic makes up 5.39% of The New York TImes Group’s total revenue.
- Subscriptions account for 76.52% of revenue while advertising makes up 21.29%.
- Subscription revenues increased by 39.38%, partly due to growth in the number of digital-only subscribers with The Athletic*.
- Additionally, advertising revenues jumped 133.50% to reach $27.95 million primarily due to display advertising launched during Q3.
- Over the given 5-year period, revenues have increased by 403.85%.
- Operating costs increased by 29.37% to reach 162.70 million during 2023, partly due to costs associated with journalism, sales and marketing and product development*.
- The Athletic operated at a loss of $31.43 million for the year, a decrease of 23.57% from 2022’s loss of $41.12 million.
- As of Q4 2023, the total subscriber base for The Athletic stands at 4.65 million.
* Revenues and operating costs in 2023 primarily increased due to accounting for an additional month over the previous year.
The Athletic revenue
- As of 2023, The Athletic made $131 million in revenue.
- This was a 54.12% increase over the previous year.
- The Athletic’s revenue increased year-on-year over the given period.
- In total, revenues increased from $26 million to $131 million (+403.85%).
- On average, this amounts to an increase of $26.25 million per year.
| Year | Revenue | Change |
| 2023 | $131 million | + 54.12% |
| 2022 | $85 million | + 30.77% |
| 2021 | $65 million | + 38.30% |
| 2020 | $47 million | + 80.77% |
| 2019 | $26 million |
A graph is given below to show annual revenues for The Athletic:

The Athletic revenue by segment
- As of 2023, 76.52% of The Athletic’s revenue comes from subscriptions, 21.29% comes from advertising and other revenues make up 2.19%.
- The Athletic made $100.45 million in revenue from subscriptions.
- This was a 39.38% increase over 2022 ($72.07 million).
- The Athletic generated $27.95 million in revenues through Advertising.
- This was a 133.50% increase over 2022 ($11.97 million).
| Year | Subscriptions | Advertising | Other |
| 2023 | $100.45 million | $27.95 million | $2.88 million |
| 2022 | $72.07 million | $11.97 million | $0.61 million |
A graph is given below to show annual revenues by segment for The Athletic:

The Athletic operating costs
- As of 2023, The Athletic has operating costs of $162.70 million.
- This is a 29.37% increase over the previous year.
- This was partly due to higher costs associated with journalism, sales and marketing and product development.
| Year | Operating costs | Change |
| 2023 | $162.70 million | + 29.37% |
| 2022 | $125.76 million |
The Athletic operating profit/loss
- As of 2023, The Athletic suffered an annual operating loss of $31.43 million.
- However, the previous year’s losses were $9.69 million greater ($41.12 million).
- This was a change in operating losses of -23.57%.
| Year | Operating profit/loss | Change |
| 2023 | – $31.43 million | – 23.57% |
| 2022 | – $41.12 million |
The Athletic total subscribers
Customers can become a subscriber of The Athletic by paying for a bundle subscription (with access to The Athletic) or by opting for a digital-only standalone subscription.
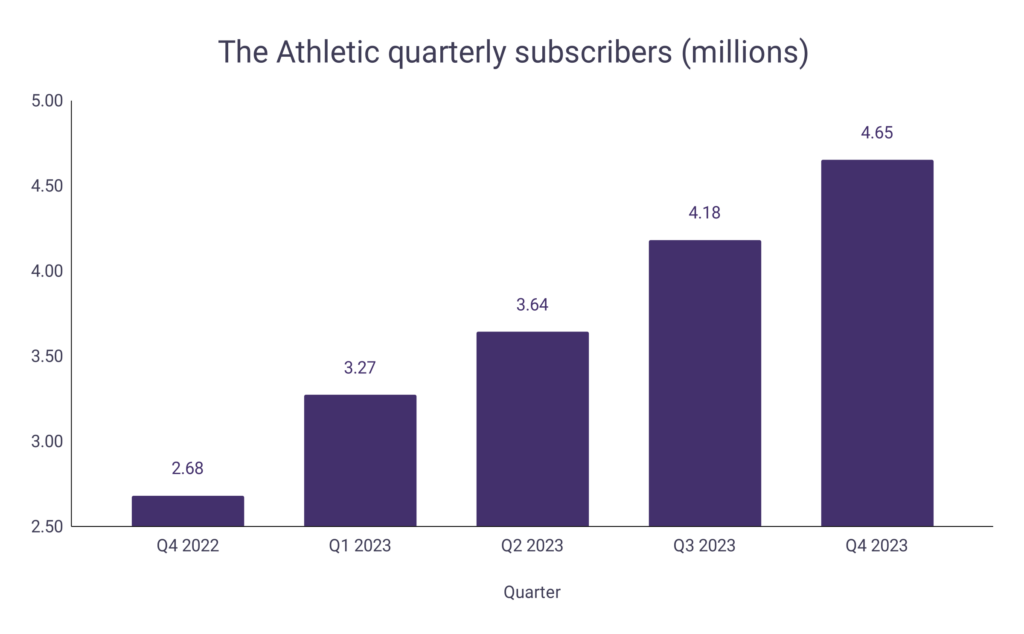
- As of Q4 2023, The Athletic has a total subscriber base of 4.65 million customers.
- This was 11.24% higher than the previous quarter and 42.20% higher than during the first quarter of the year.
- It also accounts for 44.88% of The New York Times Company’s total subscribers.
- Over the calendar year, The Athletic’s total number of subscribers increased by 1.97 million (from 2.68 million to 4.65 million).
| Quarter | Subscribers | Change |
| Q4 2023 | 4.65 million | + 11.24% |
| Q3 2023 | 4.18 million | + 14.84% |
| Q2 2023 | 3.64 million | + 11.31% |
| Q1 2023 | 3.27 million | + 22.01% |
| Q4 2022 | 2.68 million |
A graph is given below to show total quarterly subscribers for The Athletic: