

How are public libraries funded?
US public libraries depend on funding to cover the expenses of their operations, mostly employee wages and library collection maintenance. Most of the budget comes from local, state, and federal government funding, while the rest comprises private donations, fees, fines, or grants.
- US public libraries received $14.61 billion in funding for 2020, which is 2.07% more than in 2019.
- This, however, was the smallest annual increase in library funding since 2013.
- Funding for public libraries has increased by 29.04% since 2010, 89.62% since 2000, and 191.49% since 1992.
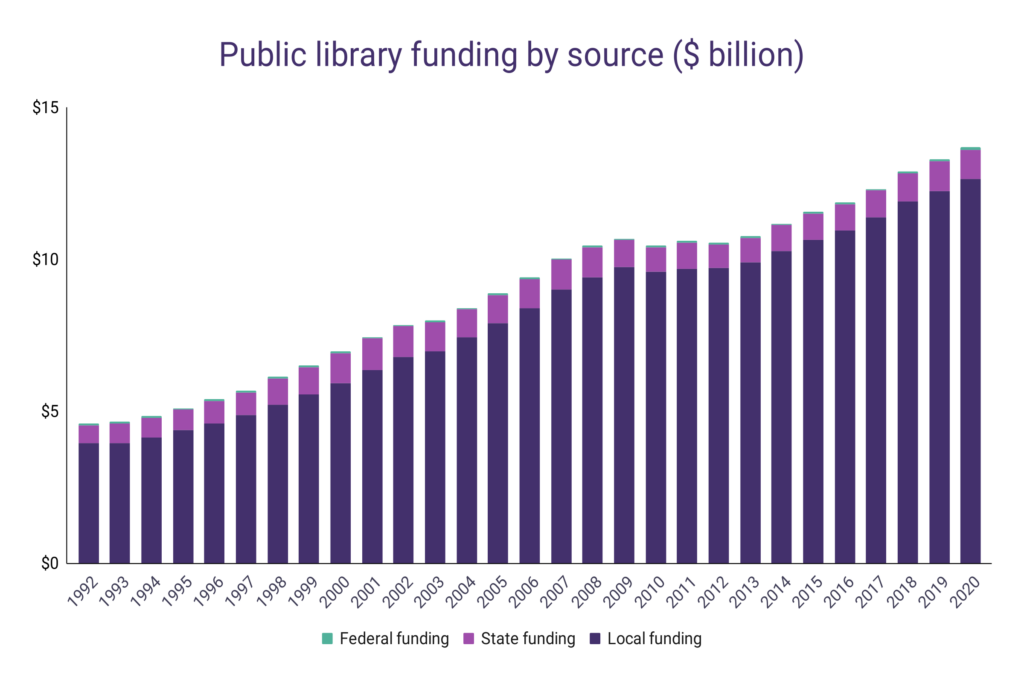
- Almost 94% (93.86%) of the library funding comes from the government (local, state, or federal), while the remaining 6.14% comes from other sources.
- Government funding has been accounting for over 90% of the public libraries funding over the past 30 years.
| Year | Government funding | Other income | Total income |
| 2020 | $13.71 | $0.90 | $14.61 |
| 2019 | $13.29 | $1.02 | $14.31 |
| 2018 | $12.89 | $0.98 | $13.87 |
| 2017 | $12.32 | $0.94 | $13.25 |
| 2016 | $11.87 | $0.90 | $12.77 |
| 2015 | $11.56 | $0.87 | $12.43 |
| 2014 | $11.18 | $0.89 | $12.07 |
| 2013 | $10.77 | $0.79 | $11.56 |
| 2012 | $10.55 | $0.95 | $11.50 |
| 2011 | $10.61 | $0.83 | $11.44 |
| 2010 | $10.45 | $0.87 | $11.32 |
| 2009 | $10.68 | $0.92 | $11.59 |
| 2008 | $10.46 | $0.93 | $11.39 |
| 2007 | $10.04 | $0.96 | $11.00 |
| 2006 | $9.40 | $0.89 | $10.29 |
| 2005 | $8.89 | $0.82 | $9.70 |
| 2004 | $8.40 | $0.73 | $9.13 |
| 2003 | $7.99 | $0.75 | $8.74 |
| 2002 | $7.84 | $0.74 | $8.59 |
| 2001 | $7.45 | $0.77 | $8.22 |
| 2000 | $6.98 | $0.73 | $7.70 |
| 1999 | $6.50 | $0.64 | $7.14 |
| 1998 | $6.13 | $0.61 | $6.74 |
| 1997 | $5.68 | $0.58 | $6.27 |
| 1996 | $5.39 | $0.51 | $5.90 |
| 1995 | $5.11 | $0.49 | $5.59 |
| 1994 | $4.84 | $0.44 | $5.28 |
| 1993 | $4.66 | $0.43 | $5.09 |
| 1992 | $4.59 | $0.42 | $5.01 |

- Local government funding to public libraries in the US stands at $12.64 billion annually and accounts for over 86.55% of the entire libraries’ income for the year.
- In 2000, local funding accounted for 77% of the libraries’ income, meaning that its share in total income increased by 12.3% over the last 10 years.
- State funding was $0.98 billion for 2020, accounting for 6.68% of libraries’ income. For reference, in 2000, state funding was 12.79% of the total income for public libraries.
- Federal funding accounts for only 0.63% of the libraries’ income, and it transferred around $80 million to public libraries in 2020. Federal funding is the smallest contributor to public libraries in the US.
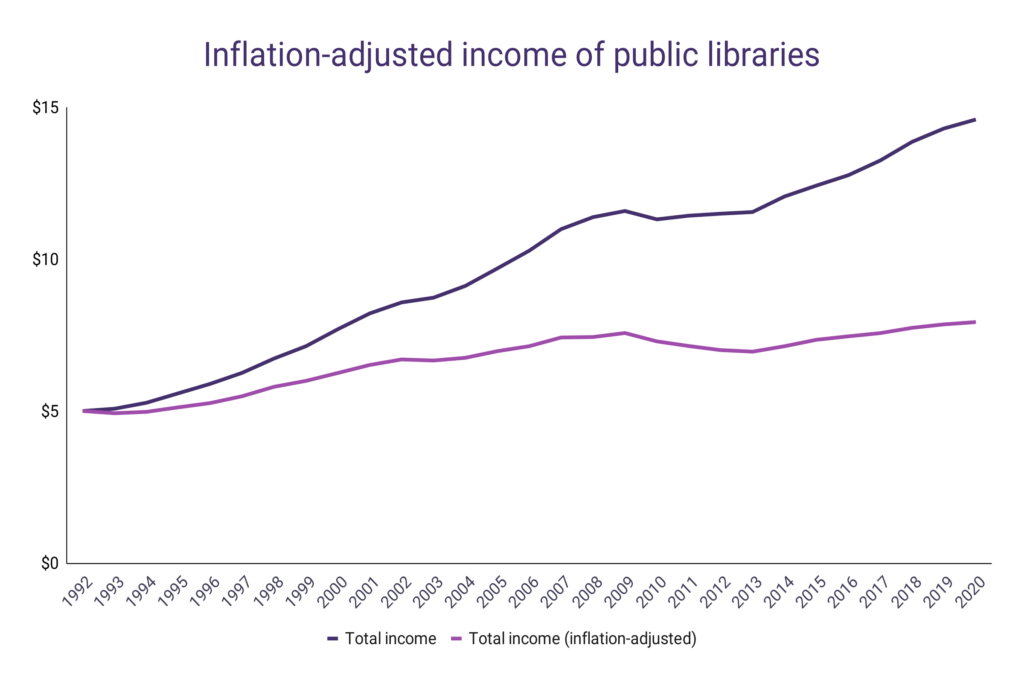
Adjusted for inflation, government funding of US public libraries has increased by only 10.48% since 2010. Total libraries funding would be $7.45 billion in 2020 with a 1992 USD value.
Still, library funding grew at a faster pace than inflation – since 1992, the inflation in the US looked through the dollar’s value was 84%, and public library funding increased by 191.49% over the same period.
The average library in the US receives around $836,810 per year through funding and donations, around 2.15% more compared to 2019. Public libraries today have a 29.03% bigger income than libraries in 2010, 86.66% more compared to 2000, and 183.47% compared to 1992.
Libraries are among the best-funded institutions for language access and WordsRated builds free tools that extend that access to word games. Our Unscramble Words and Wordle Solver are always free, and we publish hints for today’s Connections every day. If you’ve missed past Connections puzzles, our Connections Archive has a full archive.
Can public libraries survive only from funding?
- In 2020, public libraries in the US had revenue of $1,367.25 million, 46.37% more compared to 2019.
- This was a record year for public libraries in terms of revenue, primarily due to lower expenses caused by the pandemic of Covid-19.
- However, this revenue couldn’t be achieved without donations, grants, fees, fines, and other sources of income that don’t come from the government.
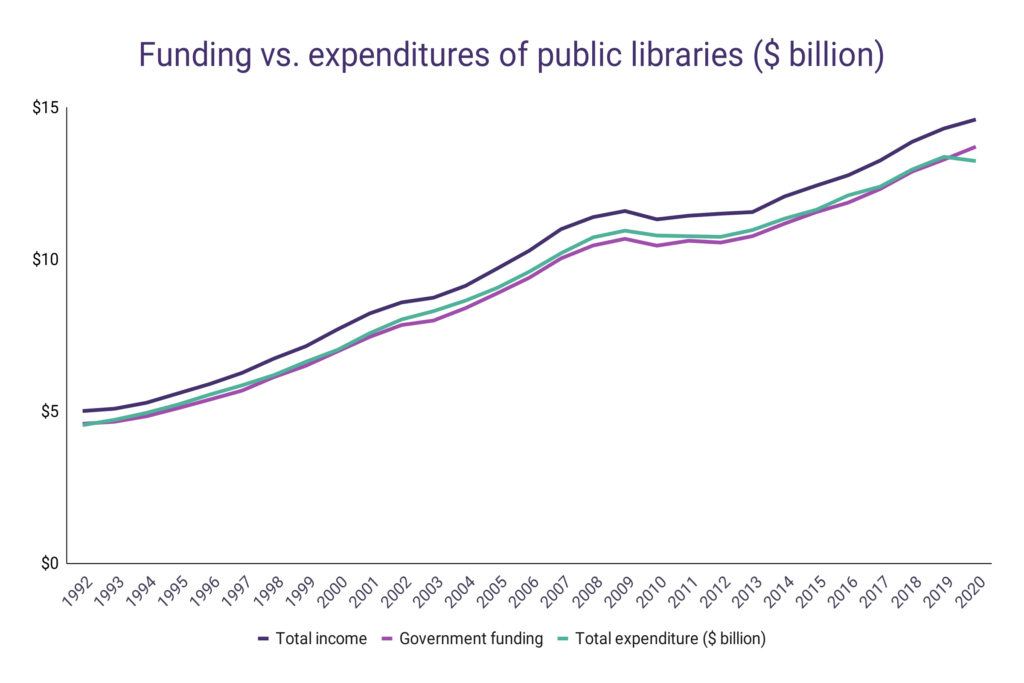
- In 2020, US public library expenses were $13.24 billion, which is around $470 million less than libraries’ funding of $13.71. This was the only year since 1992 where government t funding covered all the expenditures of public libraries.
- In all other years, for example, in 2019, public libraries’ expenditure was $90.7 million larger than local, state, and federal funding combined.
| Year | Total expenditure ($ billion) | Government funding | Total income |
| 2020 | $13.24 | $13.71 | $14.61 |
| 2019 | $13.38 | $13.29 | $14.31 |
| 2018 | $12.96 | $12.89 | $13.87 |
| 2017 | $12.40 | $12.32 | $13.25 |
| 2016 | $12.11 | $11.87 | $12.77 |
| 2015 | $11.63 | $11.56 | $12.43 |
| 2014 | $11.34 | $11.18 | $12.07 |
| 2013 | $10.97 | $10.77 | $11.56 |
| 2012 | $10.74 | $10.55 | $11.50 |
| 2011 | $10.76 | $10.61 | $11.44 |
| 2010 | $10.79 | $10.45 | $11.32 |
| 2009 | $10.95 | $10.68 | $11.59 |
| 2008 | $10.72 | $10.46 | $11.39 |
| 2007 | $10.21 | $10.04 | $11.00 |
| 2006 | $9.60 | $9.40 | $10.29 |
| 2005 | $9.07 | $8.89 | $9.70 |
| 2004 | $8.64 | $8.40 | $9.13 |
| 2003 | $8.30 | $7.99 | $8.74 |
| 2002 | $8.02 | $7.84 | $8.59 |
| 2001 | $7.57 | $7.45 | $8.22 |
| 2000 | $7.03 | $6.98 | $7.70 |
| 1999 | $6.63 | $6.50 | $7.14 |
| 1998 | $6.19 | $6.13 | $6.74 |
| 1997 | $5.86 | $5.68 | $6.27 |
| 1996 | $5.56 | $5.39 | $5.90 |
| 1995 | $5.23 | $5.11 | $5.59 |
| 1994 | $4.95 | $4.84 | $5.28 |
| 1993 | $4.72 | $4.66 | $5.09 |
| 1992 | $4.55 | $4.59 | $5.01 |
More funding means more borrowers and visits
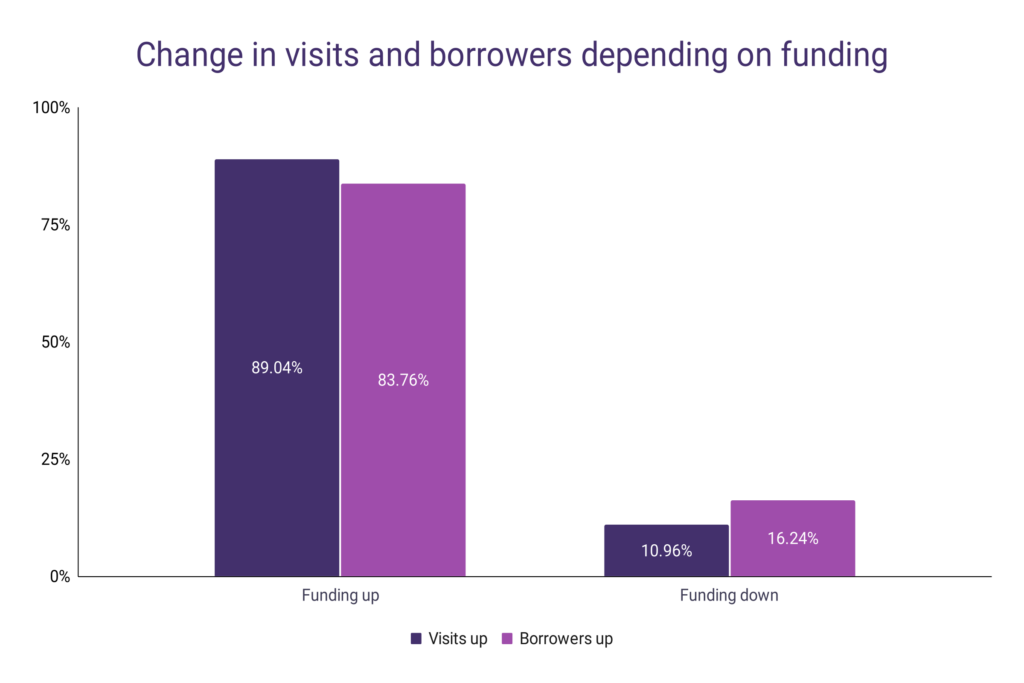
When we look at historical data, one trend is noticeable – if the library funding increases annually, visits and the number of borrowers are much more likely to increase as well.
To understand this, we looked into state-level data on public libraries. We noted all the instances where overall funding was up/down and then analyzed how the number of borrowers and library visits per library changed in relation to that. This is the conclusion:
- When the number of public library borrowers (per library) went up compared to the previous year, the funding was also up in 83.76% of cases.
- Only in 16.24% of cases did the number of borrowers increase with the decrease in library funding.
- Similarly, 89.04% of increases in library visits (per library) occurred during the years with the increased library funding.
- Only 10.96% chances are that the visits go up when the funding goes down.
Library funding by state
- With over $1.82 billion of income through funding and other sources, California’s public libraries receive the most funds on an annual basis among all US states.
- New York’s libraries receive around $1.48 billion annually, the second-most in the country.
- California and New York public libraries get over 22.7% of the total library funding in the US.
- 8 most-funded states in the US receive over 50% of the total library funding as of 2020.
- The average public library in DC receives over $2,354,740 in funding, the most in the country.
- On the other hand, the average public library in Vermont receives only $119,957 in funding, the least in the country.
- With over $354,354 in annual revenue, Colorado libraries are the most profitable public libraries in the US.
- Hawaiian libraries lose around $75,027 annually on average, making them the least profitable public libraries in the country.
| Year | State | Total Income | Funding/library | Income/library | Revenue | Revenue per library | Revenue (funding only) |
| 2020 | Ohio | $933,075,847 | $1,108,577 | $1,200,870 | $215,011,827 | $276,720 | $143,299,953 |
| 2020 | Colorado | $422,203,527 | $1,450,881 | $1,535,286 | $97,447,372 | $354,354 | $74,236,154 |
| 2020 | Florida | $690,576,081 | $1,204,795 | $1,239,813 | $76,004,273 | $136,453 | $56,499,270 |
| 2020 | Illinois | $908,617,715 | $1,086,999 | $1,147,245 | $103,316,767 | $130,450 | $55,602,472 |
| 2020 | New Jersey | $510,509,259 | $1,102,536 | $1,131,950 | $51,314,772 | $113,780 | $38,049,394 |
| 2020 | Louisiana | $275,217,307 | $743,870 | $762,375 | $44,543,321 | $123,389 | $37,863,090 |
| 2020 | Indiana | $402,142,189 | $843,532 | $887,731 | $57,088,268 | $126,023 | $37,066,030 |
| 2020 | Kentucky | $210,620,092 | $734,730 | $763,116 | $43,791,689 | $158,666 | $35,957,160 |
| 2020 | Washington | $506,740,275 | $1,288,456 | $1,323,082 | $44,736,159 | $116,805 | $31,474,435 |
| 2020 | California | $1,825,476,195 | $1,425,755 | $1,488,969 | $100,251,253 | $81,771 | $22,750,368 |
| 2020 | Michigan | $485,096,230 | $690,460 | $738,350 | $52,180,770 | $79,423 | $20,716,624 |
| 2020 | Missouri | $310,265,727 | $756,581 | $795,553 | $34,336,907 | $88,043 | $19,137,873 |
| 2020 | Oregon | $280,981,187 | $1,184,466 | $1,243,280 | $30,364,065 | $134,354 | $17,072,125 |
| 2020 | Minnesota | $257,934,898 | $660,649 | $708,612 | $29,703,399 | $81,603 | $12,244,906 |
| 2020 | Arkansas | $93,280,375 | $376,758 | $405,567 | $16,006,817 | $69,595 | $9,380,736 |
| 2020 | Utah | $133,009,970 | $942,437 | $963,840 | $12,126,050 | $87,870 | $9,172,332 |
| 2020 | Texas | $597,820,114 | $648,315 | $669,451 | $26,112,020 | $29,241 | $7,237,470 |
| 2020 | Oklahoma | $137,465,756 | $600,644 | $627,698 | $12,621,158 | $57,631 | $6,696,536 |
| 2020 | Nevada | $110,533,367 | $1,218,298 | $1,256,061 | $9,465,837 | $107,566 | $6,142,693 |
| 2020 | South Carolina | $170,107,062 | $696,457 | $714,736 | $10,407,779 | $43,730 | $6,057,535 |
| 2020 | Nebraska | $66,959,910 | $236,505 | $247,085 | $7,026,114 | $25,927 | $4,159,129 |
| 2020 | Idaho | $69,690,356 | $402,553 | $430,187 | $8,328,579 | $51,411 | $3,851,787 |
| 2020 | Alaska | $41,704,581 | $426,214 | $438,996 | $4,645,173 | $48,897 | $3,430,943 |
| 2020 | Georgia | $219,187,901 | $517,653 | $546,603 | $14,427,166 | $35,978 | $2,818,053 |
| 2020 | North Carolina | $262,746,089 | $604,058 | $640,844 | $17,816,455 | $43,455 | $2,734,013 |
| 2020 | West Virginia | $43,761,252 | $225,137 | $244,476 | $5,674,763 | $31,703 | $2,213,094 |
| 2020 | Montana | $33,473,142 | $255,347 | $269,945 | $3,953,874 | $31,886 | $2,143,742 |
| 2020 | Wisconsin | $271,814,530 | $529,046 | $582,044 | $26,451,807 | $56,642 | $1,701,612 |
| 2020 | New Mexico | $53,867,391 | $398,471 | $424,153 | $4,223,138 | $33,253 | $961,519 |
| 2020 | Virginia | $311,599,828 | $796,400 | $803,092 | $3,550,276 | $9,150 | $953,471 |
| 2020 | South Dakota | $28,047,908 | $190,572 | $196,139 | $1,465,876 | $10,251 | $669,697 |
| 2020 | Arizona | $217,886,631 | $913,825 | $943,232 | $7,048,043 | $30,511 | $254,912 |
| 2020 | Delaware | $33,001,901 | $894,692 | $942,911 | $1,849,548 | $52,844 | $161,876 |
| 2020 | Mississippi | $51,128,563 | $203,325 | $220,382 | $3,695,860 | $15,930 | -$261,224 |
| 2020 | Wyoming | $34,109,914 | $412,629 | $448,815 | $2,064,498 | $27,164 | -$685,590 |
| 2020 | North Dakota | $22,484,660 | $221,876 | $231,801 | $64,933 | $669 | -$897,744 |
| 2020 | District of Columbia | $65,373,322 | $2,354,740 | $2,421,234 | $780,922 | $28,923 | -$1,014,416 |
| 2020 | Kansas | $156,178,461 | $376,175 | $410,996 | $11,963,126 | $31,482 | -$1,268,897 |
| 2020 | Alabama | $114,473,849 | $343,269 | $368,083 | $6,308,546 | $20,285 | -$1,408,598 |
| 2020 | Tennessee | $140,766,389 | $470,450 | $490,475 | $4,219,457 | $14,702 | -$1,527,646 |
| 2020 | New Hampshire | $67,479,588 | $274,498 | $293,390 | $2,401,084 | $10,439 | -$1,943,911 |
| 2020 | Iowa | $138,524,549 | $229,416 | $242,600 | $3,568,204 | $6,249 | -$3,959,966 |
| 2020 | Vermont | $26,976,272 | $119,957 | $141,980 | -$446,450 | -$2,350 | -$4,630,928 |
| 2020 | Hawaii | $36,968,892 | $665,991 | $697,526 | -$3,976,422 | -$75,027 | -$5,647,814 |
| 2020 | Rhode Island | $56,081,533 | $651,433 | $768,240 | $2,763,682 | $37,859 | -$5,763,238 |
| 2020 | Maine | $53,064,252 | $153,581 | $204,093 | $1,662,845 | $6,396 | -$11,470,413 |
| 2020 | Maryland | $322,323,274 | $1,392,453 | $1,534,873 | $13,713,026 | $65,300 | -$16,195,112 |
| 2020 | New York | $1,487,837,996 | $1,209,399 | $1,373,812 | $156,671,987 | $144,665 | -$21,386,604 |
| 2020 | Massachusetts | $349,580,458 | $690,628 | $748,566 | -$1,084,637 | -$2,323 | -$28,141,792 |
| 2020 | Connecticut | $215,457,086 | $782,379 | $894,013 | -$1,983,407 | -$8,230 | -$28,887,052 |
| 2020 | Pennsylvania | $351,457,236 | $458,514 | $550,011 | -$8,431,668 | -$13,195 | -$66,898,587 |