In the USA there are often discrepancies in how different the same experience impacts races and ethnicities – getting through college is no different.
The statistics vary wildly for different groups in terms of the amount of money borrowed and the likelihood of the debt to grow or be paid off quickly.
Throughout this report, the terms used may change slightly depending on the source of the data and the term they use in the report. At times, this means that like-for-like comparisons cannot be made.
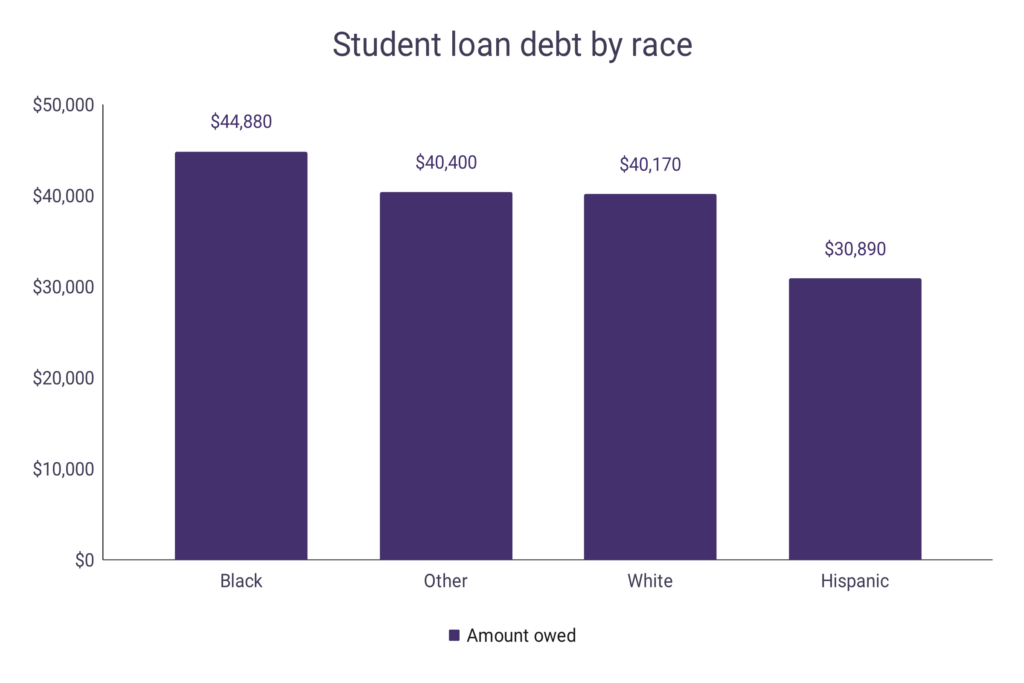
Student loan debt by race
Black students owe more on average than any other racial or ethnic group tracked by the US Federal Reserve
Hispanic students owe significantly less on average with the average Black student owing 31.2% more than the average Latino student
It has been speculated that this in part may be because undocumented students are not eligible for federal student loans but can still attend college
This leads to many Hispanic or Latino students having to find funding to attend college through other means
Race
Amount owed
Black
$44,880
Other
$40,400
White
$40,170
Hispanic
$30,890
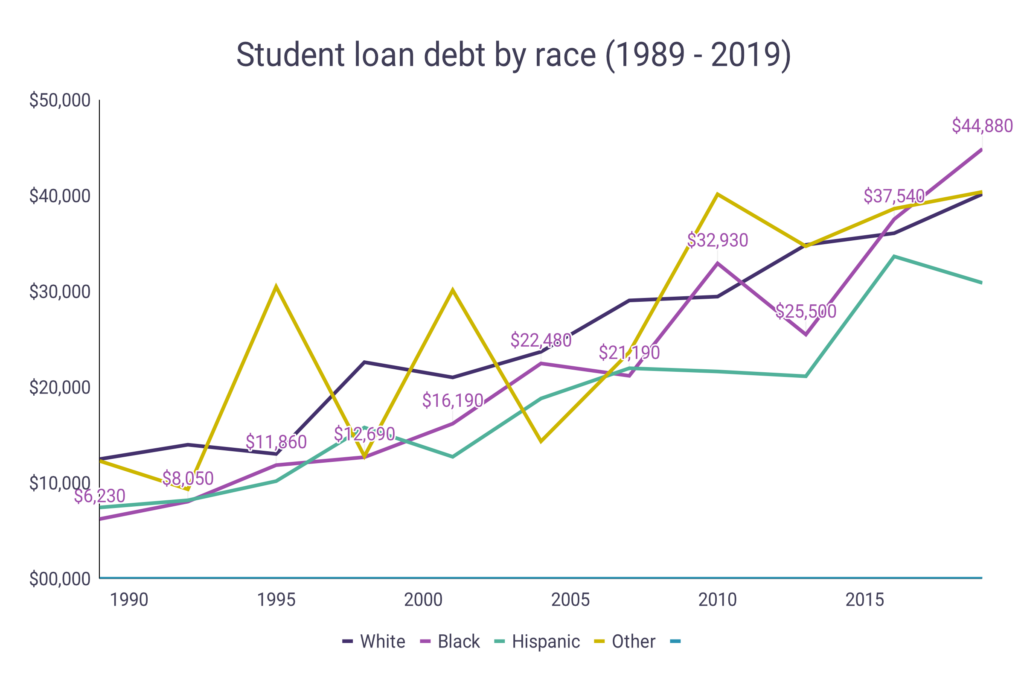
Student loan debt by race over time
In 1989, Black students had less student loan debt than any other racial group
30 years on, this trend has reversed to the point where Black students hold more debt than any other group on average
The “other” group (which includes Indian Americans, Native Alaskans, and Asian students amongst others) and White students held a similar amount of student loan debt in 1989 and still borrow a similar amount today
In 1989, Hispanic students held 59.6% of the student loan debt that White students held
By 2019, this had risen to 76.9% but they still hold $9,280 less student loan debt White students do throughout college
Year
White
Black
Hispanic
Other
1989
$12,490
$6,230
$7,440
$12,300
1992
$13,990
$8,050
$8,190
$9,340
1995
$13,030
$11,860
$10,190
$30,490
1998
$22,610
$12,690
$15,790
$12,790
2001
$21,020
$16,190
$12,730
$30,130
2004
$23,700
$22,480
$18,820
$14,350
2007
$29,060
$21,190
$21,980
$23,650
2010
$29,460
$32,930
$21,640
$40,150
2013
$34,870
$25,500
$21,140
$34,720
2016
$36,080
$37,540
$33,660
$38,640
2019
$40,170
$44,880
$30,890
$40,400
The amount of student loan debt the average black student holds now is 7.2 times the amount they held in 1989
For White and the Other group of students, the debt has tripled (3.3x and 3.2x)
Hispanic students have 4.2 times the debt they did in 1989
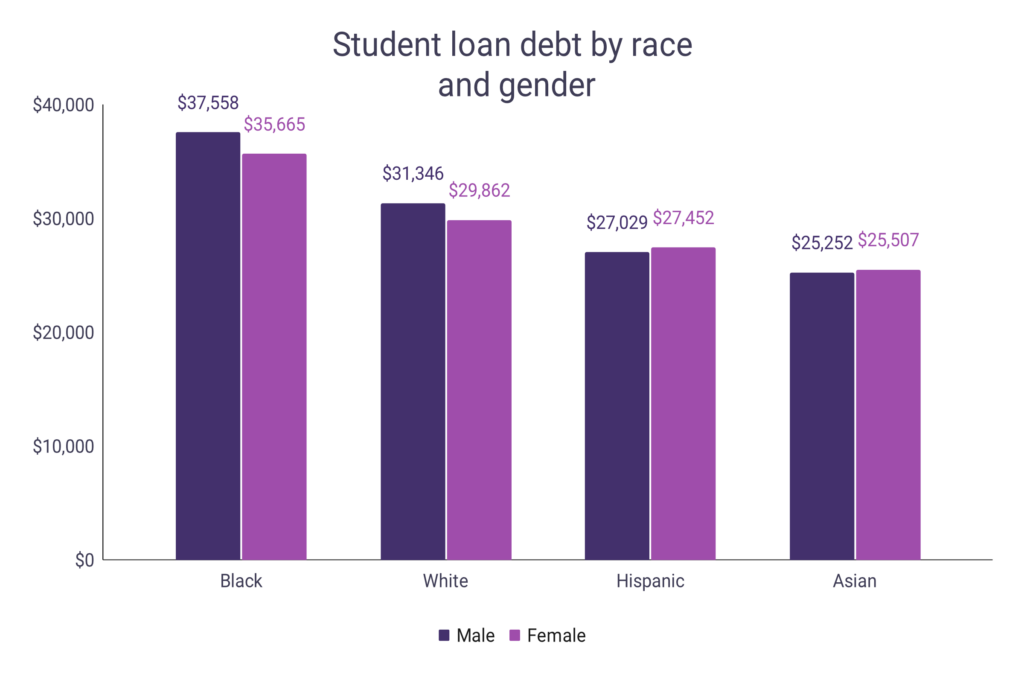
Amount borrowed by race and gender
Note: The amount borrowed is not equivalent to the student loan debt – the amount of debt depends on a number of factors such as interest, wages of graduates, and ability to repay the loan
Black men borrow 5.0% more than Black women to get through college
White men also borrow 4.7% more than White women to get through college
On the other hand, Hispanic women and Asian women borrow 1.6% and 1.0% more than their male counterparts on average
Race
Male
Female
Difference
Black
$37,558
$35,665
$1,893
White
$31,346
$29,862
$1,484
Hispanic
$27,029
$27,452
$423
Asian
$25,252
$25,507
$255
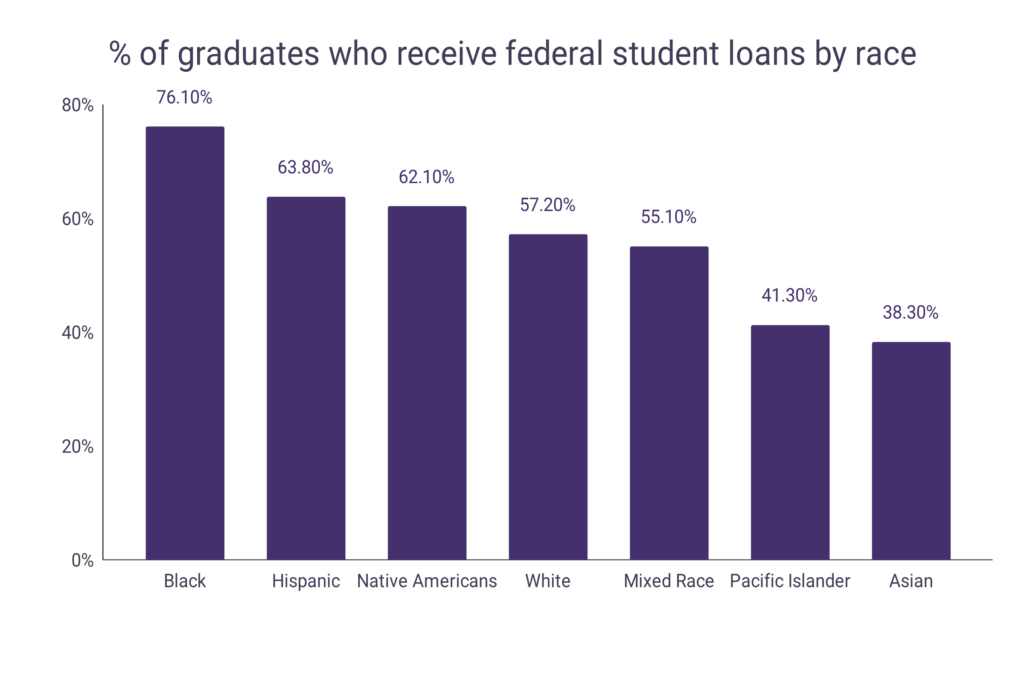
What percentage of graduates receive federal student loans by race
Black students take out student loans at a higher level than any other racial or ethnic group
Asian students are the least likely to take out a student loan
Race
Percentage
Black
76.1%
Hispanic
63.8%
Native Americans
62.1%
White
57.2%
Mixed Race
55.1%
Pacific Islander
41.3%
Asian
38.3%
Student loan debt by race and type of college
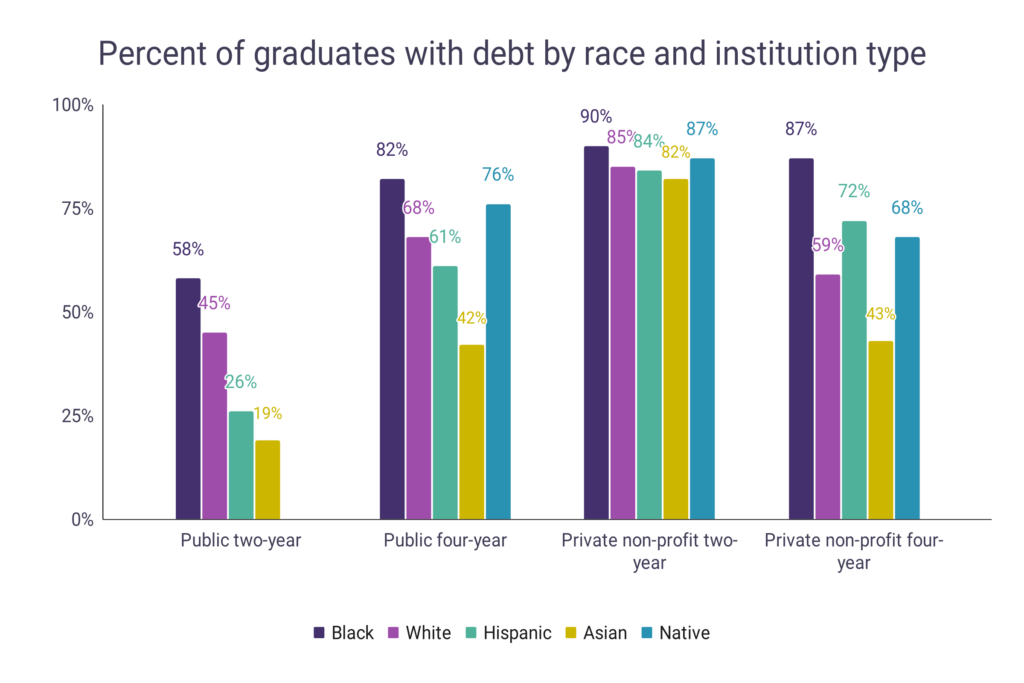
Percent of graduates with debt by race and institution type
Regardless of the institution attended, Black students are more likely to have student loan debt than students of any other racial or ethnic group
At public 2-year college, a Black student is 22% more likely to have student loan debt than a White student is
At private, non-profit, four-year colleges – a black student is a third (32%) more likely to have student loan debt than a white student.
Compared to Asian students, a Black student attending a two-year public college is 67% more likely to have student loan debt
Asian students are the least likely to have student loan debt regardless of the type of college they attend
Institution
Black
White
Hispanic
Asian
Native
Public two-year
58%
45%
26%
19%
–
Public four-year
82%
68%
61%
42%
76%
Private non-profit two-year
90%
85%
84%
82%
87%
Private non-profit four-year
87%
59%
72%
43%
68%
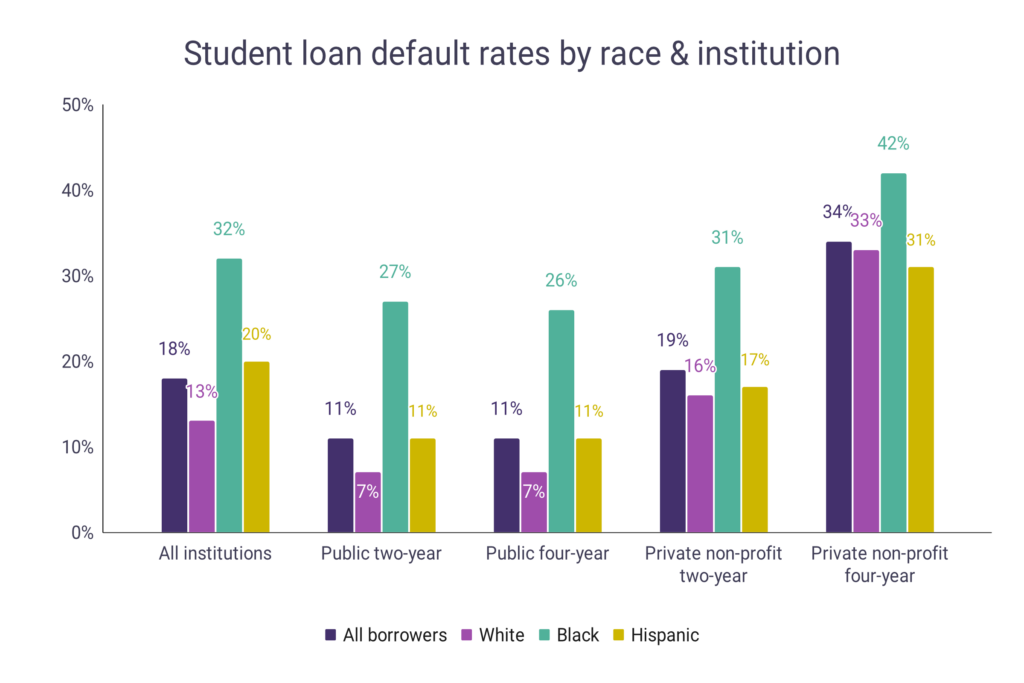
Student loan default rates by race & institution
Regardless of the type of institution attended, Black students default on their student loans at a higher rate than any other racial or ethnic group
In general, Black students are 44% more likely to default on their student loans than the average student
Institution
All borrowers
White
Black
Hispanic
All institutions
18%
13%
32%
20%
Public two-year
11%
7%
27%
11%
Public four-year
11%
7%
26%
11%
Private non-profit two-year
19%
16%
31%
17%
Private non-profit four-year
34%
33%
42%
31%
At public institutions, Black students are 59% and 58% more likely to default than the average student at 2-year and 4-year colleges respectively
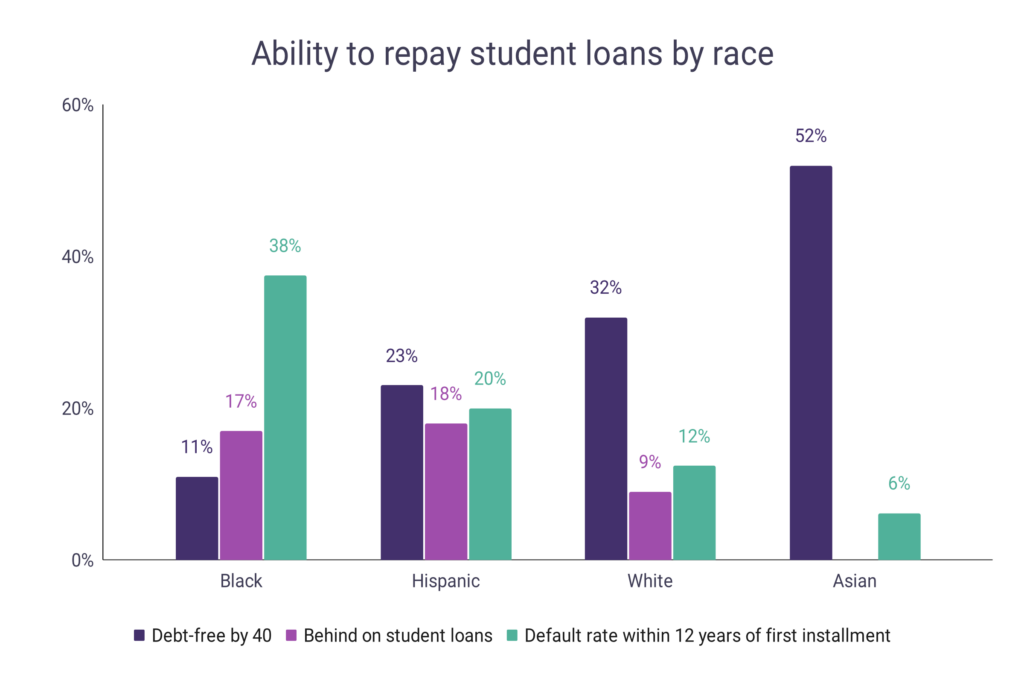
Ability to repay student loans by race
Asian students are most likely to be free of their student loan debts by the age of 40
Black students are least likely to be free of their student loan debts by the age of 40
Black and Hispanic students are almost twice as likely to be behind on their student loan repayments than White students
Black students are almost 3 times more likely to default on their student loans than White students