
The New York Times established itself as a household name due to the longevity of its daily newspaper. However, data shows that the NYT has been able to attract a more tech-savvy demographic while also increasing engagement in their products following the release of their games section, which includes their early-2022 acquisition of the hit word-game Wordle.
- In 2021, prior to the release of Wordle, there were 6.80 million NYT digital subscribers in total and revenue from these stood at $0.77 billion.
- Since then, digital subscribers have increased by 42.65% to reach 9.70 million, while their revenue has risen 42.86% to hit $1.10 billion.
- As of the first quarter of 2024, 82.69% of NYT organic website traffic visited the Wordle page.
- Between Q4 2021 (just before Wordle) and Q1 2024. total organic NYT website traffic has increased from 0.13 billion to 1.56 billion, a percentage increase of 1100%.
- As of March 2024, The official app for playing Wordle (NYT Games: Word Games & Sudoku) receives 1 million downloads per month through Apple’s App Store alone.
- In total, it receives 5 times as many downloads as the main news app of The New York Times.
- The NYT Games: Word Games & Sudoku app generates revenues of $2 million per month through the App Store, which is a revenue share of 28.69% when compared to the other key NYT apps.
- However, it also has the lowest average revenue per download of these ($2.00), as many players use the app to play Wordle and other games without the use of a paid subscription.
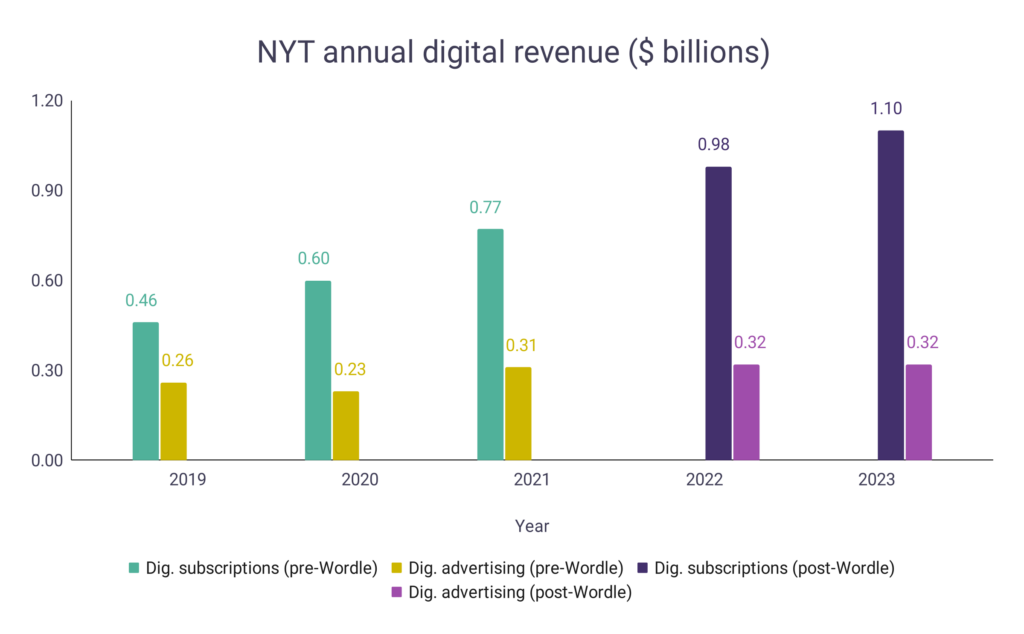
NYT digital revenues
- As of 2023, The New York Times generates $1.10 billion through digital subscriptions.
- It also generates an additional $0.32 billion through digital advertising.
- Prior to the release of Wordle in 2022, The New York TImes digital subscriptions revenue stood at $0.77 billion and revenue from digital advertising was $0.31 billion.
- Since then, digital subscription revenues have jumped 42.86%, while digital advertising revenues have increased by just 3.23%.
| Year | Digital subscriptions | Change | Digital advertising | Change |
| 2023 | $1.10 bn | + 12.24% | $0.32 bn | |
| 2022 | $0.98 bn | + 27.27% | $0.32 bn | + 3.23% |
| 2021 | $0.77 bn | + 28.33% | $0.31 bn | + 34.78% |
| 2020 | $0.60 bn | + 30.43% | $0.23 bn | – 11.54% |
| 2019 | $0.46 bn | $0.26 bn |
A graph is given below to show annual digital revenues for The New York Times:
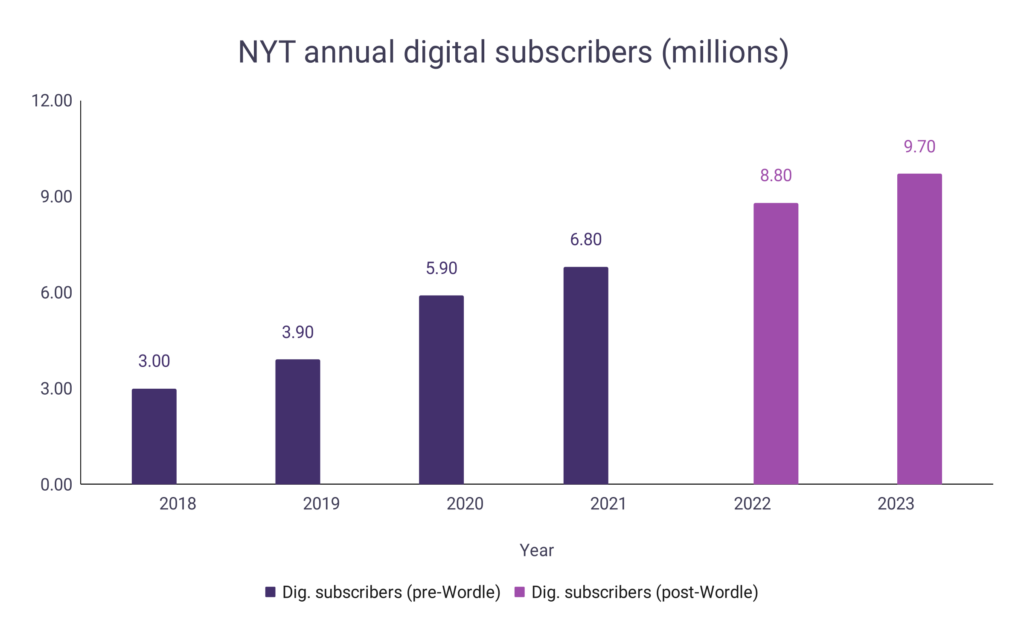
NYT digital subscribers
- As of 2023, the New York Times has 9.70 million digital subscribers (news-only, bundle & multiproduct and other single-product subscriptions).
- This shows an increase of 10.23% over 2022’s 8.80 million subscribers.
- At the end of 2021, prior to the release of Wordle, there were 6.80 million total digital subscribers.
- Since then, digital subscribers have increased by 2.90 million (+42.65%).
| Year | Digital subscribers* | Change |
| 2023 | 9.70 m | + 10.23% |
| 2022 | 8.80 m | + 29.41% |
| 2021 | 6.80 m | + 15.25% |
| 2020 | 5.90 m | + 51.28% |
| 2019 | 3.90 m | + 30.00% |
| 2018 | 3.00 m |
A graph is given below to show the annual digital subscriber count for The New York Times:
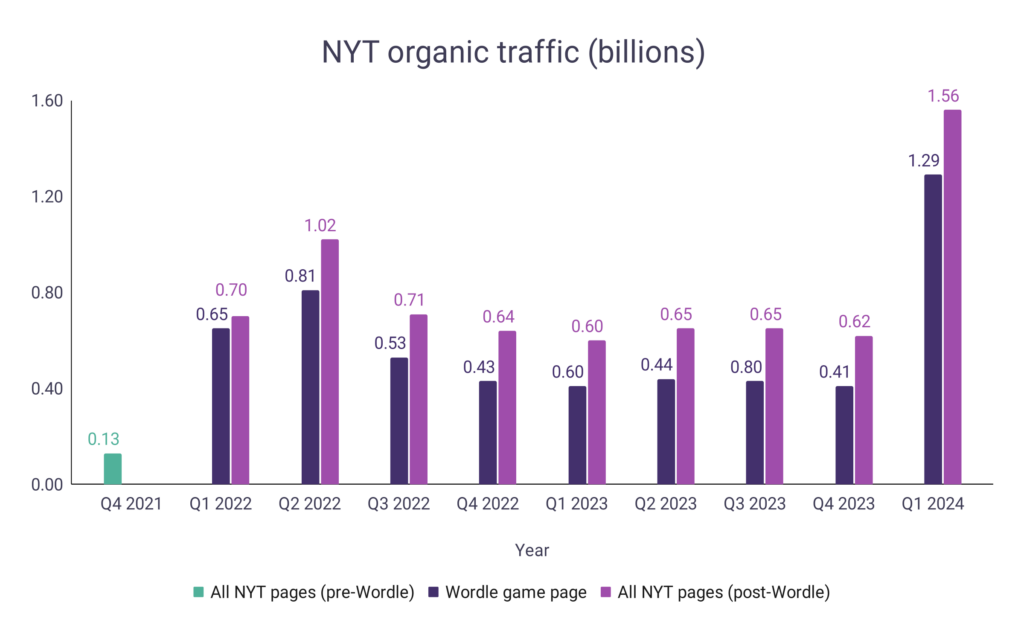
NYT organic traffic
- As of Q1 2024, the NYT Wordle page accounts for 82.69% of the NYT’s total organic traffic.
- In the quarter before Wordle was launched (Q4 2021), the New York Times received just 0.13 billion in organic traffic.
- As of Q1 2024, this has increased by 1100% to reach 1.56 billion.
- Meanwhile, in just two years organic traffic to Wordle’s game page has increased 98.46% from 0.65 billion to 1.29 billion.
| Quarter | Wordle (game page) | Change | NYT (total) | Change |
| Q1 2024 | 1.29 bn | + 214.63% | 1.56 bn | + 151.61% |
| Q4 2023 | 0.41 bn | – 4.65% | 0.62 bn | – 4.62% |
| Q3 2023 | 0.43 bn | – 2.27% | 0.65 bn | |
| Q2 2023 | 0.44 bn | + 7.32% | 0.65 bn | + 8.33% |
| Q1 2023 | 0.41 bn | – 4.65% | 0.60 bn | – 6.25% |
| Q4 2022 | 0.43 bn | – 18.87% | 0.64 bn | – 9.86% |
| Q3 2022 | 0.53 bn | – 34.57% | 0.71 bn | – 30.39% |
| Q2 2022 | 0.81 bn | + 24.62% | 1.02 bn | + 45.71% |
| Q1 2022 | 0.65 bn* | 0.70 bn | + 438.46% | |
| Q4 2021 | 0.13 bn |
A graph is given below to show organic traffic for The New York Times:
NYT app downloads
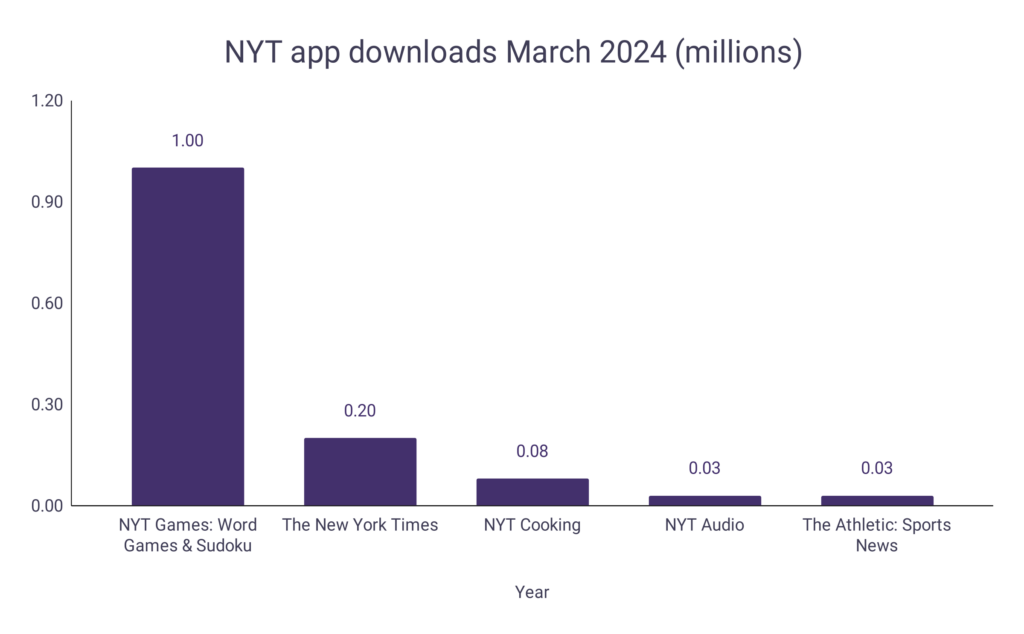
- As of March 2024, there are 5 main NYT apps on Apple’s App store.
- The NYT Games: Word Games & Sudoku app receives 1 million downloads per month on this store, more than any other NYT app.
- In total, this app represents 74.63% of all downloads for NYT apps.
- Furthermore, the NYT Games: Word Games & Sudoku app receives 5 times as many downloads as the main New York Times app, which is used for news.
| App name | Downloads (March 2024) | Download share (NYT apps) |
| The New York Times | 0.20 m | 14.93% |
| NYT Games: Word Games & Sudoku | 1.00 m | 74.63% |
| NYT Cooking | 0.08 m | 5.97% |
| NYT Audio | 0.03 m | 2.24% |
| The Athletic: Sports News | 0.03 m | 2.24% |
A graph is given below to show app downloads for The New York Times:
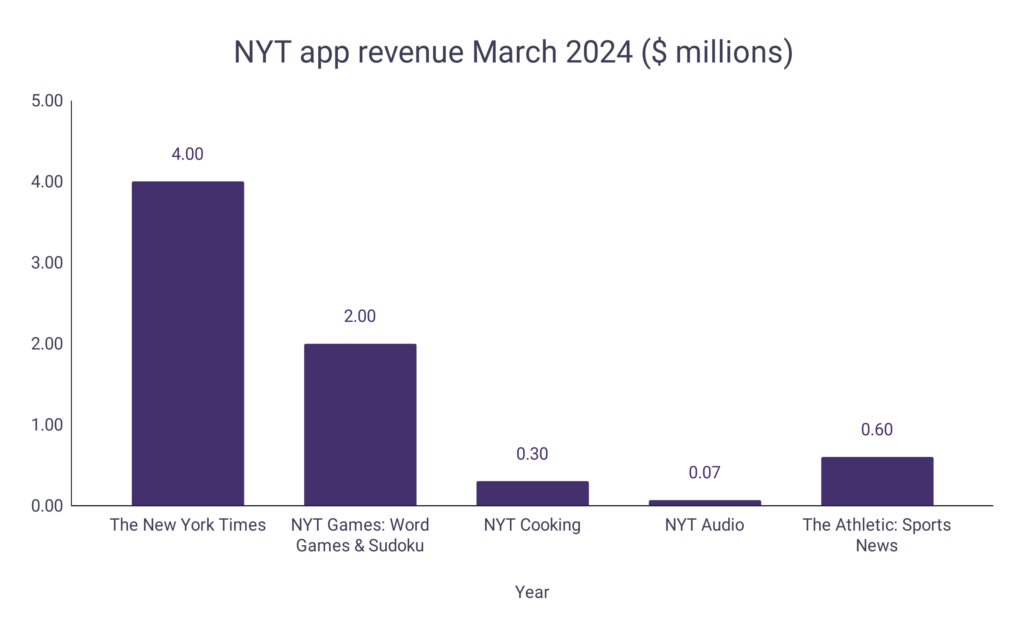
NYT app revenue
- As of March 2024, The NYT Games: Word Games & Sudoku app has revenues of $2.00 million per month through the App Store.
- This makes for a revenue share of 28.69% when compared against other NYT apps.
- However, it has the lowest average revenue per download ($2.00), which indicates that many players still use the app without purchasing a subscription.
- In contrast, The New York Times news app generates revenues of $4.00 million per month and has an average revenue per download of $20.00.
- This app has a revenue share of 57.39% when compared with the other NYT apps.
- NYT news readers may be more tempted to purchase a subscription to read a range of articles, while NYT game players may be more satisfied to play the multiple free games on offer without making a purchase.
| App name | Total revenue (March 2024) | Average revenue per download (March 2024) | Revenue share (NYT apps) |
| The New York Times | $4.00 m | $20.00 | 57.39% |
| NYT Games: Word Games & Sudoku | $2.00 m | $2.00 | 28.69% |
| NYT Cooking | $0.30 m | $3.75 | 4.30% |
| NYT Audio | $0.07 m | $2.33 | 1.00% |
| The Athletic: Sports News | $0.60 m | $20.00 | 8.61% |
A graph is given below to show revenue for The New York Times apps: