

Top teacher shortage and recruitment statistics
- Teacher attrition in the USA is twice as high as in countries with well-regarded education systems like Finland and Singapore
- It causes a distract $20,000 every time a teacher quits
- Teachers of mathematics, science, special education, English language development, and foreign languages are more likely to leave either their school or teaching
- Turnover rates are 50% higher for teachers in Title I schools – schools that serve a high percentage of low-income students
- Mathematics and science teacher turnover rates are nearly 70% greater in Title I schools than in non-Title I schools
- Attrition rates are also 70% higher for teachers in schools serving the largest concentrations of students of color
- Teachers in districts where max salary can exceed $72,000 are 31% less likely to move districts or quit teaching
- Just under 40% of teachers plan on leaving the profession in the next two years
- There was a 41% increase in the number of teachers who quit in June 2022 compared to the previous year
Teacher vacancy statistics
- There are an estimated 36,504 teacher vacancies in the USA
- More than 100,000 classrooms are staffed by someone who is not fully qualified to teach
- 90% of open teaching positions are created by teachers who leave the profession
- 44% of public schools began the school year with teaching vacancies
- 45% of schools have special education vacancies
- 31% have elementary school teaching vacancies
- 20% have substitute teacher positions that are unfilled
- The leading causes of teacher vacancies are:
- Resignation (51%)
- Retirement (21%)
- More than 50% of schools are filling vacancies by hiring teachers outside of their subject expertise or intended roles
- 49% of public schools have at least one non-teaching staff vacancy
- 28% of schools have vacancies for custodial staff
- Transportation staff and nutrition staff positions were each reported as vacant by 14% of schools
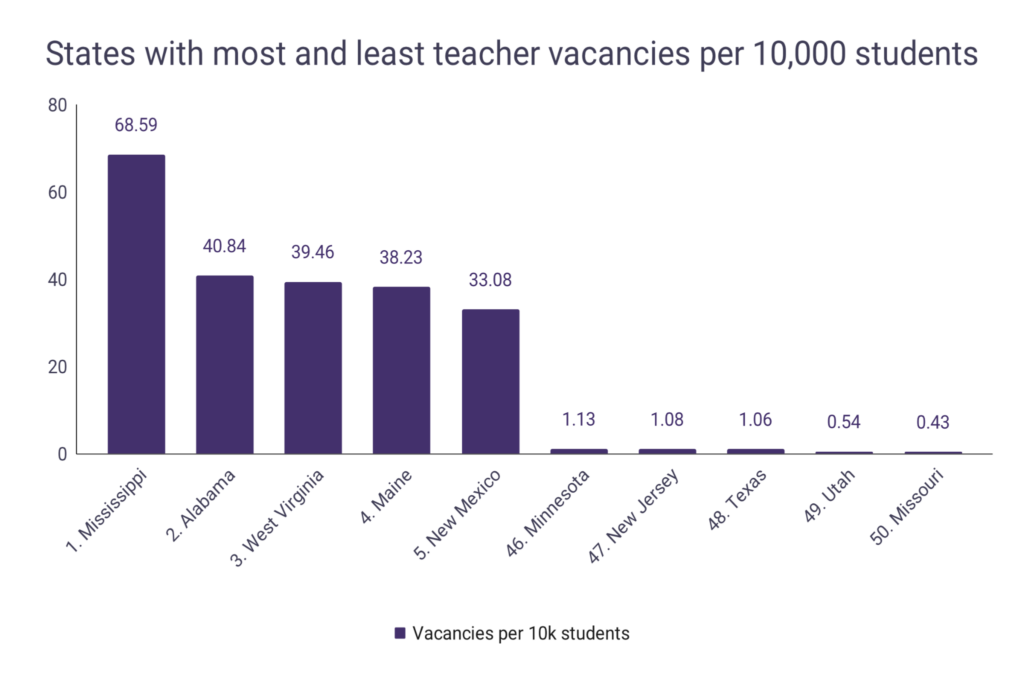
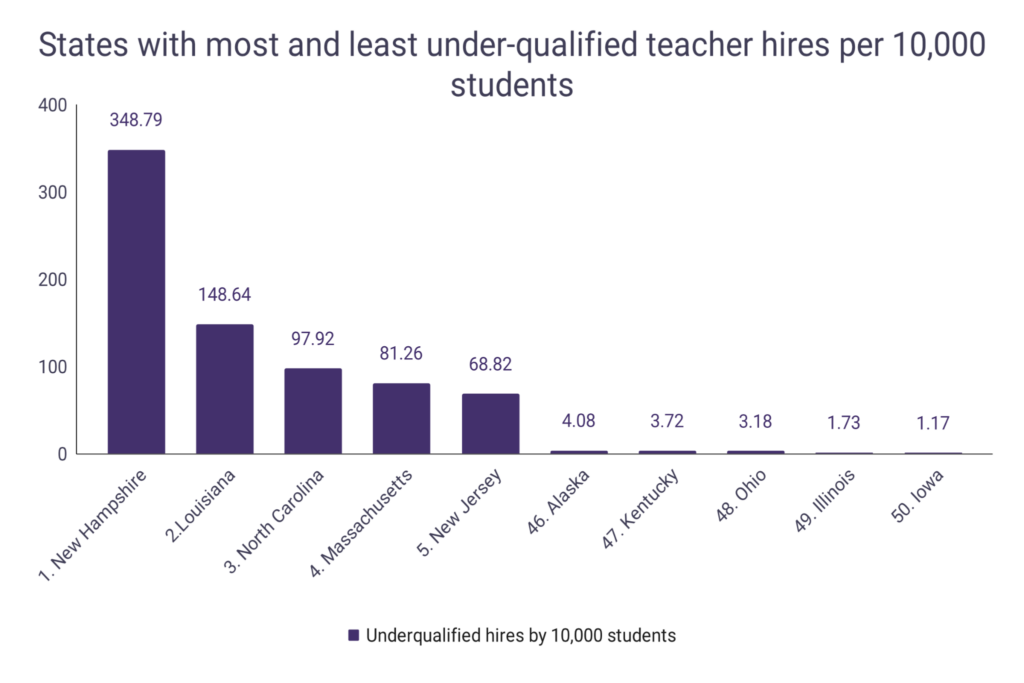
Teacher vacancies per 10,000 students by State
| State | Vacancies by 10k students | Underqualified |
| Alabama | 40.84 | 68.69 |
| Alaska | – | 4.08 |
| Arizona | 15.22 | 32.56 |
| Arkansas | – | 30.8 |
| California | – | 38.88 |
| Colorado | 2.66 | 10.11 |
| Connecticut | 4.47 | 9.57 |
| Delaware | 14.85 | 20.57 |
| Florida | 14.02 | 59.45 |
| Georgia | 17.59 | 29.5 |
| Hawaii | 20.63 | 40.69 |
| Idaho | 15.6 | 15.8 |
| Illinois | 8.76 | 1.73 |
| Indiana | 9.48 | 9.21 |
| Iowa | – | 1.17 |
| Kansas | 24.91 | 15.49 |
| Kentucky | 12.24 | 3.72 |
| Louisiana | – | 148.64 |
| Maine | 38.23 | 26.91 |
| Maryland | 11.33 | 41.45 |
| Massachusetts | – | 81.26 |
| Michigan | 3.52 | 5.92 |
| Minnesota | 1.13 | 50.44 |
| Mississippi | 68.59 | 34.36 |
| Missouri | 0.43 | 40.2 |
| Montana | 22.41 | 6.01 |
| Nebraska | 1.29 | 5.39 |
| Nevada | 16.99 | 22.17 |
| New Hampshire | – | 348.79 |
| New Jersey | 1.08 | 68.82 |
| New Mexico | 33.08 | 22.91 |
| New York | – | 19.55 |
| North Carolina | 11.22 | 97.92 |
| North Dakota | 12.74 | 4.39 |
| Ohio | – | 3.18 |
| Oklahoma | 7.07 | 17.7 |
| Oregon | – | 6.56 |
| Pennsylvania | 1.99 | 6.28 |
| Rhode Island | 6.68 | 12.93 |
| South Carolina | 12.23 | 8.24 |
| South Dakota | 8.61 | 5.1 |
| Tennessee | 12.18 | 15.05 |
| Texas | 1.06 | 16.19 |
| Utah | 0.54 | 58.27 |
| Vermont | – | 11.89 |
| Virginia | 11.35 | 30.03 |
| Washington | – | 51.68 |
| West Virginia | 39.46 | 18.07 |
| Wisconsin | 30.9 | 16.22 |
| Wyoming | – | 19.45 |
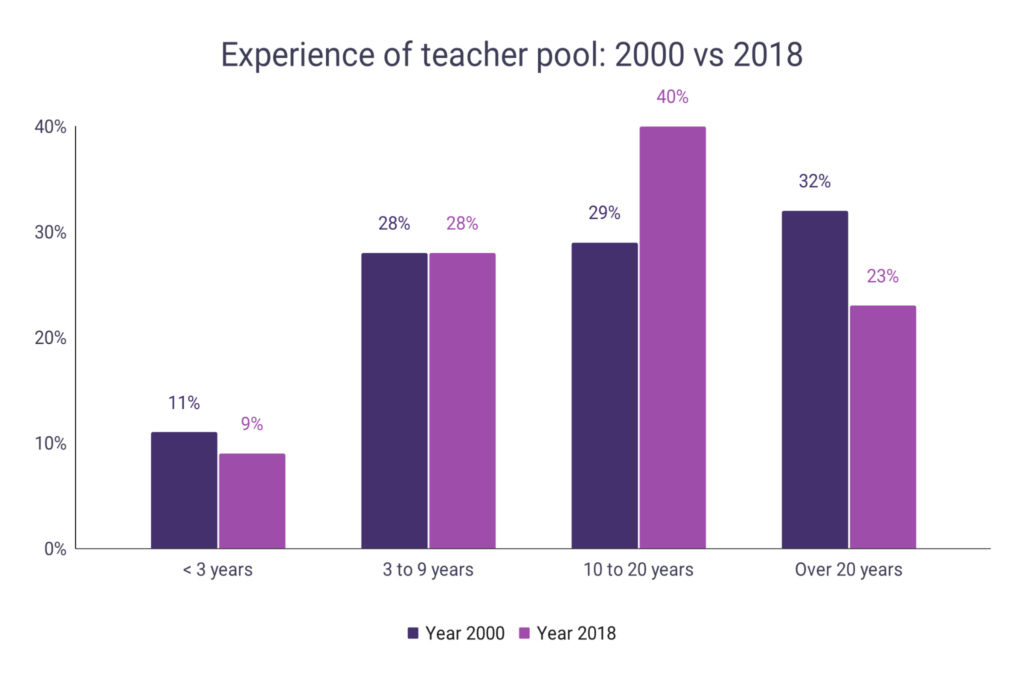
Teacher experience level: 2000 vs 2018
- There are fewer teachers now with more than 20 years of teaching experience now than there were in 2000
- There are also fewer teachers with less than 3 years of experience now as a percentage of all teachers
- There are significantly more teachers with 10 to 20 years of experience than there were in 2000 with 40% of teachers having between 10 and 20 years of experience as a teacher
| Years of experience | Year 2000 | Year 2018 |
| < 3 years | 11% | 9% |
| 3 to 9 years | 28% | 28% |
| 10 to 20 years | 29% | 40% |
| Over 20 years | 32% | 23% |