Even with the numerous benefits that reading brings, the average person uses only a tiny fraction of their free time on this vital activity. Other activities, such as watching TV, playing video games, and spending time in front of a mobile screen, have occupied a much bigger portion of Americans’ leisure time.
This is a comprehensive report on the reading habits of Americans – how much of their daily time they spend reading, how genders and different age and racial groups differ when it comes to reading time, and how parenting and employment affect the time Americans spend reading.
How much time do Americans spend reading?
- The average American citizen over 15 years of age spends around 16 minutes and 48 seconds reading for personal pleasure during the typical day as of 2021.
- People are reading around 30 seconds more, on average, compared to 2019 when reading time for the average American was about 16 minutes and 12 seconds.
- Even though the average time spent reading in the US increased over the past 3 years by more than 1 minute per day, reading time is way down compared to the earlier years of the previous decade.
- Since 2012, time spent reading for Americans decreased by 15.15%, from 19 minutes and 48 seconds in 2012 to 16 minutes and 48 seconds 10 years later.
- Covid-impacted 2020 and 2021 might have produced an increase in reading time, so it will be interesting to see what the statistics for 2022 will look like.
| Year | Daily average reading time (minutes) | Change |
| 2021 | 16:48 | 3.70% |
| 2019 | 16:12 | 3.85% |
| 2018 | 15:36 | -7.14% |
| 2017 | 16:48 | -3.45% |
| 2016 | 17:24 | -9.38% |
| 2015 | 19:12 | 0.00% |
| 2014 | 19:12 | 0.00% |
| 2013 | 19:12 | -3.03% |
| 2012 | 19:48 | |
| Since 2012 | -15.15% |

While the reading time might be up, the share of US citizens who engage in leisure reading on a daily basis is on the decline:
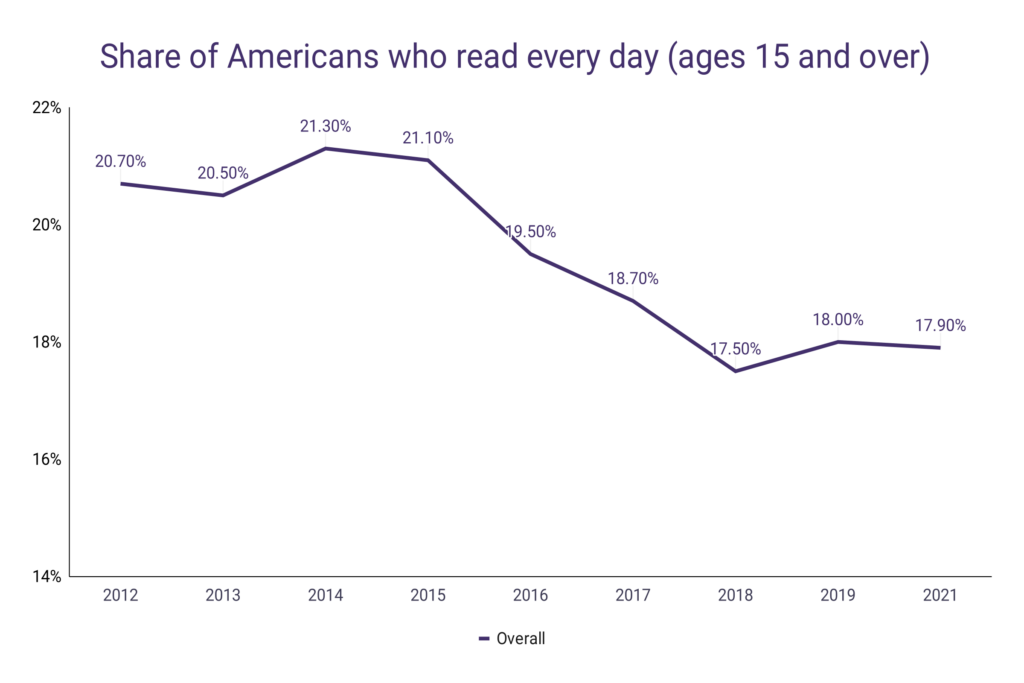
- On average, 17.90% of Americans ages 15 and over read every day as of 2021.
- The share of US citizens who engage in daily reading has declined in 8 out of the past 10 years.
- For 5 years in a row, under 20% of Americans read every day for personal interest, reaching the lowest point in 2018 when only 17.5% of people engaged in this activity.
- Since 2012, the share of Americans who read every day has declined by 13.53%.
| Year | Share of Americans who read every day | Change |
| 2021 | 17.90% | -0.56% |
| 2019 | 18.00% | 2.86% |
| 2018 | 17.50% | -6.42% |
| 2017 | 18.70% | -4.10% |
| 2016 | 19.50% | -7.58% |
| 2015 | 21.10% | -0.94% |
| 2014 | 21.30% | 3.90% |
| 2013 | 20.50% | -0.97% |
| 2012 | 20.70% | |
| Since 2012 | -13.53% |

If we look only at people who do read every day, their reading time is significantly higher compared to the country’s average. However, everyday readers are also reading less today compared to the previous decade.
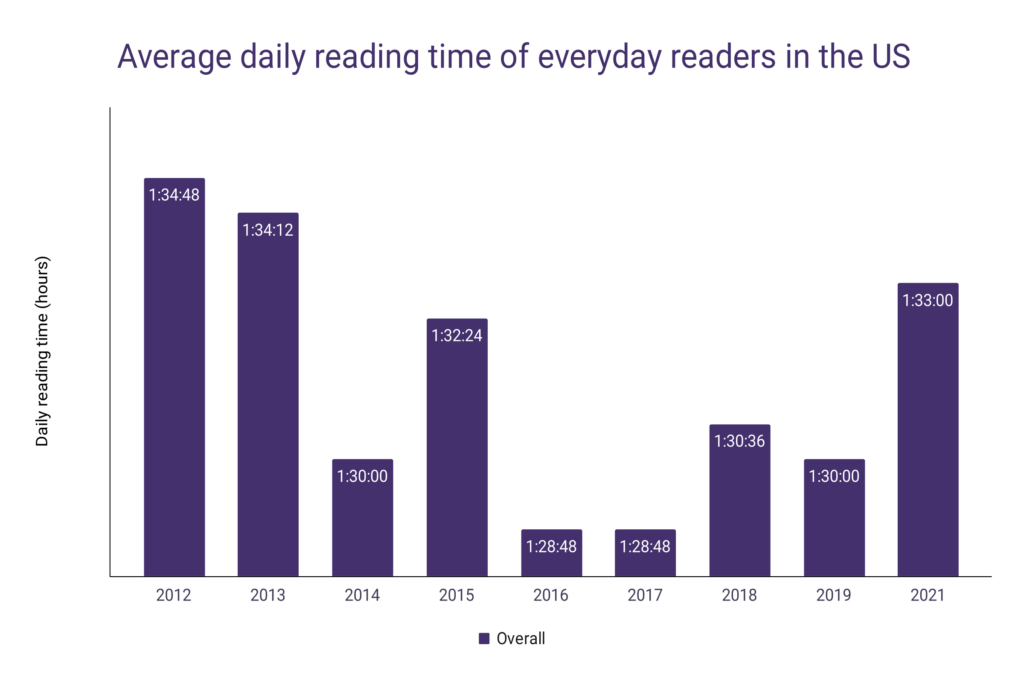
- US citizens who engage in reading activity daily (on average) spend around 1 hour and 33 minutes reading during leisure time.
- However, since 2012, reading time for everyday readers is down by 1.9%, dropping from 1 hour and 34 minutes.
- A good sign might be the fact that the reading time in 2021 has been the highest since 2013 and has grown in 4 out of the last 5 years.
- The average everyday reader in the US is spending more than 5 more times reading for personal interest compared to the average US citizen.
| Year | Average daily reading time for everyday readers | Change |
| 2021 | 1:33:00 | 3.33% |
| 2019 | 1:30:00 | -0.66% |
| 2018 | 1:30:36 | 2.03% |
| 2017 | 1:28:48 | 0.00% |
| 2016 | 1:28:48 | -3.90% |
| 2015 | 1:32:24 | 2.67% |
| 2014 | 1:30:00 | -4.46% |
| 2013 | 1:34:12 | -0.63% |
| 2012 | 1:34:48 | |
| Since 2012 | -1.90% |

Average reading time for men and women
Women are historically better and more committed readers compared to men. However, both genders read less today compared to the previous decade, and both have fewer everyday readers over the same period.
- The average American male spends around 13 minutes and 48 seconds during the day reading for personal interest, while the average woman in the US reads for 19 minutes and 12 seconds per day.
- This means that women spend 39.13% more time in reading activities during the typical day as of 2021.
- The biggest difference in reading time between the two genders was recorded in 2017, when women spent exactly 50% more time reading compared to men.
- Over the past 10 years, men’s reading time during the average day declined by 11.54% while reading time for American women is down 15.79% over the same period.
| Year | Reading time men | Change | Reading time women | Change | Difference w/m |
| 2021 | 13:48 | 0.00% | 19:12 | 3.23% | 39.13% |
| 2019 | 13:48 | -4.17% | 18:36 | 6.90% | 34.78% |
| 2018 | 14:24 | 9.09% | 17:24 | -12.12% | 20.83% |
| 2017 | 13:12 | -12.00% | 19:48 | 0.00% | 50.00% |
| 2016 | 15:00 | -7.41% | 19:48 | -10.81% | 32.00% |
| 2015 | 16:12 | 0.00% | 22:12 | 0.00% | 37.04% |
| 2014 | 16:12 | 3.85% | 22:12 | -2.63% | 37.04% |
| 2013 | 15:36 | 0.00% | 22:48 | 0.00% | 46.15% |
| 2012 | 15:36 | 22:48 | 46.15% | ||
| Since 2012 | -11.54% | -15.79% |

Aside from reading more during the typical day compared to men, a bigger share of US women reads every day than other gender(s).
- Around 14.7% of men and 20.8% of women aged over 15 engage in reading for pleasure every day in the US. This makes women 41.50% more likely to read every day compared to men.
- However, both genders are facing a decline in everyday readers compared to the previous decade – 16% fewer men and 12.24% fewer women read for personal interest every day in the US compared to 2012.
| Year | Share of everyday readers, men | Change | Share of everyday readers, women | Change | Difference w/m |
| 2021 | 14.70% | -8.13% | 20.80% | 4.52% | 41.50% |
| 2019 | 16.00% | -1.23% | 19.90% | 5.85% | 24.38% |
| 2018 | 16.20% | 6.58% | 18.80% | -14.55% | 16.05% |
| 2017 | 15.20% | -10.59% | 22.00% | 0.92% | 44.74% |
| 2016 | 17.00% | -6.59% | 21.80% | -8.79% | 28.24% |
| 2015 | 18.20% | 1.11% | 23.90% | -1.65% | 31.32% |
| 2014 | 18.00% | 4.05% | 24.30% | 3.85% | 35.00% |
| 2013 | 17.30% | -1.14% | 23.40% | -1.27% | 35.26% |
| 2012 | 17.50% | 23.70% | 35.43% | ||
| Since 2012 | -16.00% | -12.24% |

What is interesting is that, for the first time, male everyday readers spend more time reading compared to the female everyday readers in the US:
- On average, men who engage in reading for pleasure every day spend around 1 hour and 34 minutes on this activity, 8.97% more compared to 2019.
- On the other hand, female everyday readers spend around 1 hour and 31 minutes on leisure reading, a slight drop compared to 2019.
- The difference in reading time between male and female everyday readers in the US has been declining over the years, and in 2021 men read longer than women for the first time.
- Since 2012, male everyday readers increased their average time spent reading by 5.33% while female readers read around 6.13% less compared to 2012.
| Year | Reading time, men (everyday readers) | Change | Reading time, women (everyday readers) | Change |
| 2021 | 1:34:48 | 8.97% | 1:31:48 | -0.65% |
| 2019 | 1:27:00 | -2.68% | 1:32:24 | 1.32% |
| 2018 | 1:29:24 | 2.76% | 1:31:12 | 1.33% |
| 2017 | 1:27:00 | 0.00% | 1:30:00 | 0.00% |
| 2016 | 1:27:00 | -3.33% | 1:30:00 | -3.85% |
| 2015 | 1:30:00 | 2.04% | 1:33:36 | 2.63% |
| 2014 | 1:28:12 | -2.00% | 1:31:12 | -6.75% |
| 2013 | 1:30:00 | 0.00% | 1:37:48 | 0.00% |
| 2012 | 1:30:00 | 1:37:48 | ||
| Since 2012 | 5.33% | -6.13% |

Average reading time by age group
The older people get – the more time they commit to reading during leisure time. The difference in daily reading time between the youngest and the oldest generation is enormous. However, over the past decade there have been some positive trends in terms of reading time for youngsters, while seniors started to relocate their free time to other activities.
- During 2021, Americans aged between 15 and 24 spent just above 9 and a half minutes per day on leisure reading.
- People aged 25 to 54 read around 10 minutes and 48 seconds, while citizens between 55 and 64 of age read for 17 minutes and 24 seconds per day.
- Senior citizens, over 65 years of age, spend over 34 minutes reading for personal interest as of 2021.
- Over the past 10 years, the average daily reading time for Americans aged 15 to 24 increased by 23.08%, jumping from 7 minutes and 48 seconds.
- During the same period, all other age groups have shortened their daily reading time – ages 25 to 54 by 10%, ages 55 to 64 by 32.56%, and Americans over 65 years of age by 29.63%.
| Year | Ages 15 to 24 | Ages 25 to 54 | Ages 55 to 64 | Ages 65+ |
| 2021 | 09:36 | 10:48 | 17:24 | 34:12 |
| 2019 | 06:36 | 10:12 | 16:48 | 36:36 |
| 2018 | 06:36 | 08:24 | 16:12 | 41:24 |
| 2017 | 07:12 | 09:36 | 18:00 | 41:24 |
| 2016 | 07:48 | 09:36 | 22:12 | 40:48 |
| 2015 | 09:00 | 11:24 | 22:12 | 48:36 |
| 2014 | 10:12 | 10:12 | 22:12 | 49:12 |
| 2013 | 10:48 | 09:36 | 25:12 | 49:48 |
| 2012 | 07:48 | 12:00 | 25:48 | 48:36 |
| Last year | 45.45% | 5.88% | 3.57% | -6.56% |
| Since 2012 | 23.08% | -10.00% | -32.56% | -29.63% |

A similar trend appears when we look at the share of people within each of the age groups that read every day – the youngest read the least but are growing the fastest.
- Over 10.8% of Americans aged 15 to 24 report reading every day for personal interest as of 2021.
- Citizens aged between 25 and 54 have around 13.10% of everyday readers among them, while ages 55 to 64 have over 20.50% of everyday readers.
- Senior citizens read books every day in 31.80% of cases, the most among all age groups.
- However, since 2012, the share of everyday readers among Americans aged 15 to 24 has increased by 22.73%, and this is the only age group that increased the number of everyday readers over this period.
- On the other hand, people aged 65 and over have 25.35% fewer everyday readers compared to 2012.
| Year | Everyday readers aged 15 to 24 | 25 to 54 | 55 to 64 | 65+ |
| 2021 | 10.80% | 13.10% | 20.50% | 31.80% |
| 2019 | 8.80% | 13.60% | 19.60% | 34.70% |
| 2018 | 7.60% | 11.70% | 21.40% | 36.90% |
| 2017 | 8.50% | 13.50% | 22.70% | 37.20% |
| 2016 | 9.40% | 13.70% | 25.50% | 38.30% |
| 2015 | 10.00% | 15.30% | 25.50% | 43.00% |
| 2014 | 10.10% | 15.00% | 27.40% | 43.90% |
| 2013 | 12.00% | 13.40% | 27.30% | 42.80% |
| 2012 | 8.80% | 15.40% | 27.20% | 42.60% |
| Last year | 22.73% | -3.68% | 4.59% | -8.36% |
| Since 2012 | 22.73% | -14.94% | -24.63% | -25.35% |

Average reading time by race and ethnicity
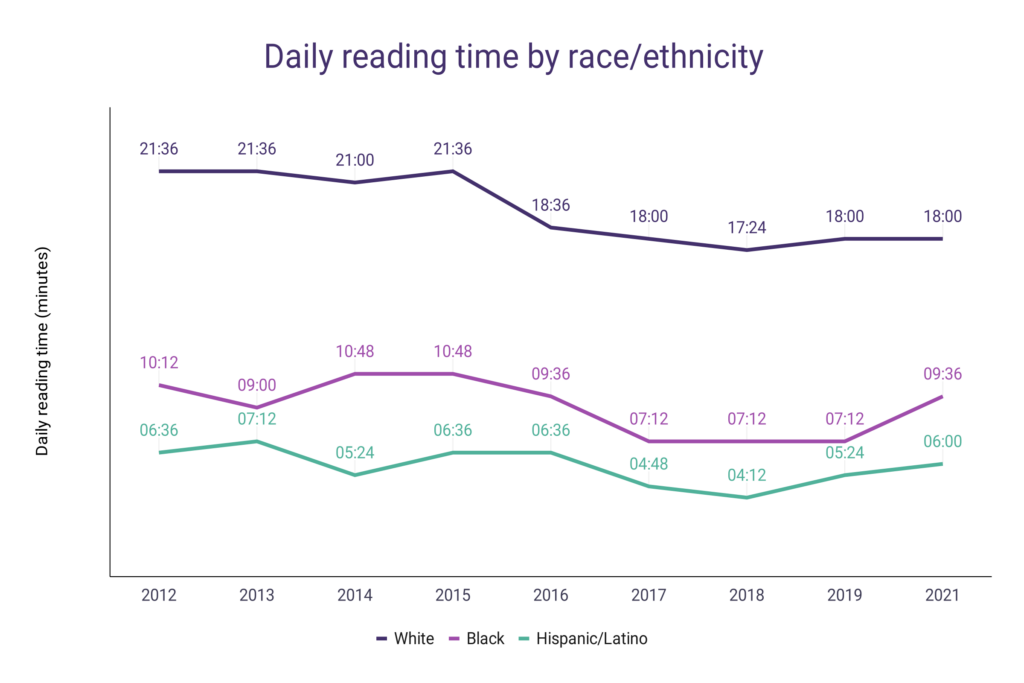
- White Americans spend around 18 minutes per day reading for personal interest as of 2021.
- Black US citizens read just over 9 and a half minutes per day over the same period.
- Hispanic/Latino Americans spend the least time reading for pleasure among the major ethnic and racial groups, around 6 minutes daily.
- While all 3 groups decreased their reading time over the past 10 years, white Americans had the biggest decline, dropping from over 21 and a half minutes in 2012, a 16.67% decrease.
- Over the same period, Black Americans decreased their daily reading time by 5.88%, while Hispanic and Latine citizens dropped by 9.09%.
| Year | White | Change | Black | Change | Hispanic/Latino | Change |
| 2021 | 18:00 | 0.00% | 09:36 | 33.33% | 06:00 | 11.11% |
| 2019 | 18:00 | 3.45% | 07:12 | 0.00% | 05:24 | 28.57% |
| 2018 | 17:24 | -3.33% | 07:12 | 0.00% | 04:12 | -12.50% |
| 2017 | 18:00 | -3.23% | 07:12 | -25.00% | 04:48 | -27.27% |
| 2016 | 18:36 | -13.89% | 09:36 | -11.11% | 06:36 | 0.00% |
| 2015 | 21:36 | 2.86% | 10:48 | 0.00% | 06:36 | 22.22% |
| 2014 | 21:00 | -2.78% | 10:48 | 20.00% | 05:24 | -25.00% |
| 2013 | 21:36 | 0.00% | 09:00 | -11.76% | 07:12 | 9.09% |
| 2012 | 21:36 | 10:12 | 06:36 | |||
| Since 2012 | -16.67% | -5.88% | -9.09% |


