

This report provides an analysis of Princeton’s financial information, focusing on revenue, expenditure, and net operating assets. Recent data shows an upward trajectory for both revenue and expenditure at the educational institution.
- As of the 2021/22 academic year, Princeton generated revenues of $2.36 billion.
- This was 9.00% higher than 2020/21’s $2.16 billion.
- Over the given 5-year period, revenues have increased by 17.12%.
- 65.21% of Princeton’s total revenue is generated through investment earnings distributed.
- In total, Princeton University had expenses of $2.00 billion.
- Total expenses have increased by 8.66% since the $1.84 billion spent in 2020/21.
- Over the given 5-year period, expenditure has increased by 16.36%.
- 43.20% of the overall spend is on salaries and wages.
- As of the 2021/22 academic year, Princeton made a net operating asset gain of $357.96 million.
Princeton University revenue
To sustain operations, Princeton University has a range of income streams, with investment earnings serving as the main source of funding. Furthermore, the university secures substantial revenue through grants, contracts, and gifts.
Total revenue
- As of the 2021/22 academic year, Princeton generated revenues of $2.36 billion.
- This was 9.00% higher than 2020/21’s $2.16 billion.
- Over the given period, revenues have increased by 17.12%.
- From the given data, 2021/22 generated the highest revenues.
- 2020/21 saw reductions in revenue from tuition & fees and auxiliary sales/services.
- The impact of the pandemic likely contributed to revenue drops in these areas.
| Academic year | Total revenue | Change |
| 2017/18 | $2.01bn | |
| 2018/19 | $2.15bn | +6.64% |
| 2019/20 | $2.17bn | +1.25% |
| 2020/21 | $2.16bn | -0.49% |
| 2021/22 | $2.36bn | +9.00% |
A graph is given below to show Princeton’s total revenue:

Revenue by type
- As of the 2021/22 academic year, Princeton generated $1.54 billion in revenues through investment earnings distributed.
- Investment earnings distributed made up 65.21% of the total revenue.
- $360 million was generated through government grants and contracts.
- Government grants and contracts made up 15.37% of the total revenue.
- $200 million was generated through private gifts, grants and contracts.
- Private gifts, grants and contracts made up 8.62% of the total revenue.
| Revenue type | 2017/18 | 2018/19 | 2019/20 | 2020/21 | 2021/22 | Change vs 20/21 |
| Tuition and fees | $0.11bn | $0.13bn | $0.13bn | $0.10bn | $0.14bn | +38.49% |
| Government grants and contracts | $0.29bn | $0.31bn | $0.34bn | $0.34bn | $0.36bn | +5.92% |
| Private gifts, grants and contracts | $0.14bn | $0.22bn | $0.17bn | $0.17bn | $0.20bn | +21.99% |
| Auxiliary sales and services | $0.10bn | $0.08bn | $0.06bn | $0.03bn | $0.07bn | +118.73% |
| Other operating revenues | $0.06bn | $0.04bn | $0.03bn | $0.05bn | $0.04bn | -25.68% |
| Investment earnings distributed | $1.31bn | $1.37bn | $1.44bn | $1.47bn | $1.54bn | +4.72% |
| Total | $2.01bn | $2.15bn | $2.17bn | $2.16bn | $2.36bn | +9.00% |
A graph is given below to show Princeton’s total revenue by type:

Princeton University expenditure
Recent data shows that Princeton University has seen steady growth in its overall expenditure. Although spending patterns vary, the institution directs the majority of its expenditure towards salaries and wages.
Total expenditure
- As of the 2021/22 academic year, Princeton had expenses of $2.00 billion.
- This was the highest total expenditure over the given period.
- Total expenses have increased by 8.66% since the $1.84 billion spent in 2020/21.
- This increase coincides with a vastly increased expenditure on salaries, wages, supplies and services.
- Over the given 5-year period, expenditure has increased by 16.36%.
- Expenditure has also increased year-on-year over the period.
| Academic year | Total expenditure | Change |
| 2017/18 | $1.72bn | |
| 2018/19 | $1.74bn | +1.31% |
| 2019/20 | $1.80bn | +3.19% |
| 2020/21 | $1.84bn | +2.43% |
| 2021/22 | $2.00bn | +8.66% |
A graph is given below to show Princeton’s total expenditure:

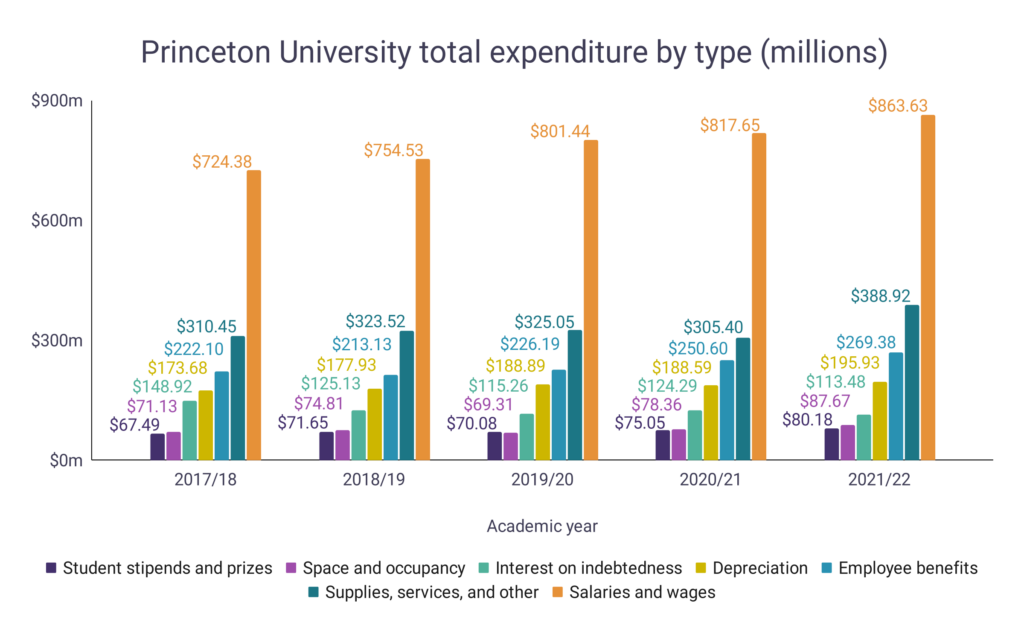
Expenditure by type
- As of the 2021/22 academic year, Princeton spent $863.63 million on salaries and wages.
- Salaries and wages made up 43.20% of the overall spend.
- $388.92 million was spent on supplies, services and other.
- Supplies, services and other made up 19.45% of the overall spend.
- $269.38 million was spent on employee benefits.
- Employee benefits made up 13.47% of the overall spend.
| Expense type | 2017/18 | 2018/19 | 2019/20 | 2020/21 | 2021/22 | Change vs 20/21 |
| Salaries and wages | $724.38m | $754.53m | $801.44m | $817.65m | $863.63m | +5.62% |
| Employee benefits | $222.10m | $213.13m | $226.19m | $250.60m | $269.38m | +7.49% |
| Supplies, services, and other | $310.45m | $323.52m | $325.05m | $305.40m | $388.92m | +27.35% |
| Space and occupancy | $71.13m | $74.81m | $69.31m | $78.36m | $87.67m | +11.88% |
| Student stipends and prizes | $67.49m | $71.65m | $70.08m | $75.05m | $80.18m | +6.84% |
| Depreciation | $173.68m | $177.93m | $188.89m | $188.59m | $195.93m | +3.89% |
| Interest on indebtedness | $148.92m | $125.13m | $115.26m | $124.29m | $113.48m | -8.70% |
| Total | $1.72bn | $1.74bn | $1.80bn | $1.84bn | $2.00bn | +8.66% |
A graph is given below to show Princeton’s total expenditure by type:
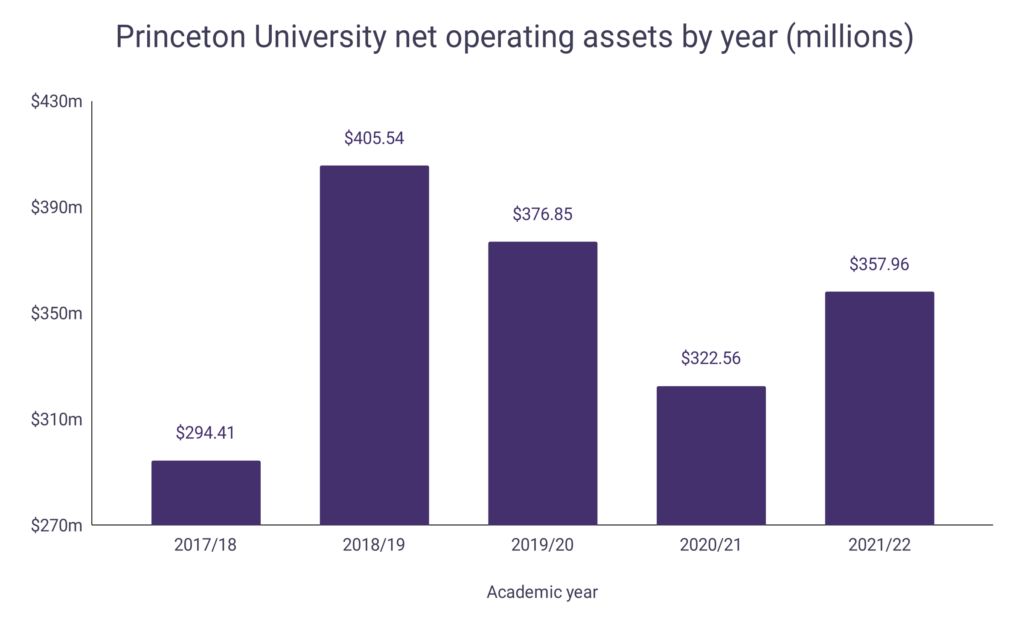
Princeton University net operating assets
- As of the 2021/22 academic year, Princeton made a net operating asset gain of $357.96 million.
- 2018/19 saw the greatest net operating asset gain over the given period ($405.54 million).
- The pandemic likely affected net operating assets gains during the following academic years.
- During 2019/20 and 2020/21, expenditure on salaries, wages, and employee benefits continued to rise.
- However, despite this trend, revenues remained largely stagnant.
- Princeton saw average annual net operating asset gains of $351.46 million over the 5-year period.
| Academic year | Net operating assets | Change |
| 2017/18 | +$294.41m | |
| 2018/19 | +$405.54m | +37.74% |
| 2019/20 | +$376.85m | -7.07% |
| 2020/21 | +$322.56m | -14.41% |
| 2021/22 | +$357.96m | +10.97% |
A graph is given below to show Princeton’s net operating assets:
Princeton revenue FAQ
Where does Princeton University’s funding come from?
- Princeton’s funding predominantly comes from:
- Investment earnings distributed.
- Government grants and contracts.
- Private gifts, grants, and contracts.
What are Princeton University’s main expenses?
- Princeton’s main expenses include:
- Salaries and wages.
- Supplies, services, and other.
- Employee benefits.
Is Princeton University for profit?
- Princeton University is a private, non-profit Ivy League institution that utilizes its revenue for internal reinvestment.
- The university allocates these funds in order to meet operational requirements.
- The strategic allocation of funds allows for the improvement of resources alongside the enhancement of student services.