The importance of reading for educational development can not be overestimated. However, various factors, primarily economic and social, lead to differences in reading ability among children of different races and ethnicities.
In this report, we’ll show how reading performance in elementary, middle, and high school changes depending on the race and ethnicity of children. We hope that these reports, conducted by NAEP, can provide a better understanding of inequalities that lead to unbalanced reading performance across races.
Elementary school reading performance by race and ethnicity
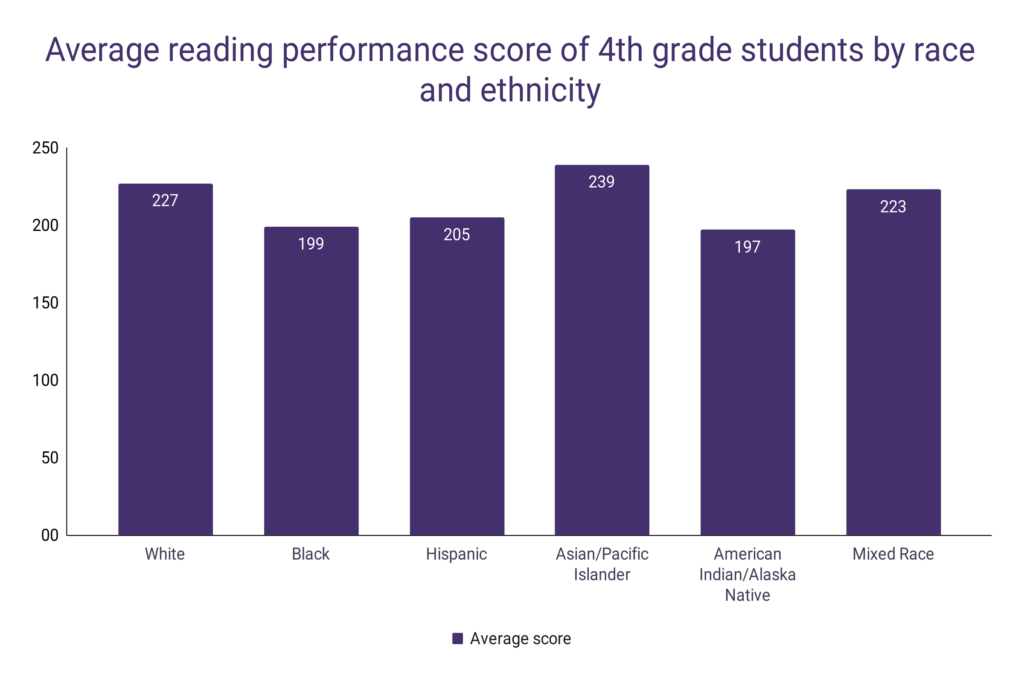
Among all major races/ethnicities in US elementary schools, children of Asian origin showed the best reading comprehension performance, averaging 239 points (out of 500) on NAEP’s scale in 2022.
White children (227 points) and mixed-race students (223) are following behind.
On the other hand, 4th-grade students of Hispanic origin, as well as Black and American Indian, show a significant drop in reading performance compared to the above-mentioned groups.
Overall, over the last 10 years, students of Asian origin are the only group that showed improvement in reading comprehension, a 1.70% jump, while all other groups declined.
Black 4th graders have a 3.40% drop compared to 2013, White students declined by 2.16%, while Hispanic students dropped by less than 1%.
Year
White
Black
Hispanic
Asian/Pacific Islander
American Indian/Alaska Native
Mixed Race
2022
227
199
205
239
197
223
2019
230
204
209
237
204
226
2017
232
206
209
239
202
227
2015
232
206
208
239
205
227
2013
232
206
207
235
205
227
2011
231
205
206
235
202
227
2009
230
205
205
235
204
226
2007
231
203
205
232
203
225
2005
229
200
203
229
204
223
2003
229
198
200
226
202
223
Average reading performance score of 4th grade students by race and ethnicity
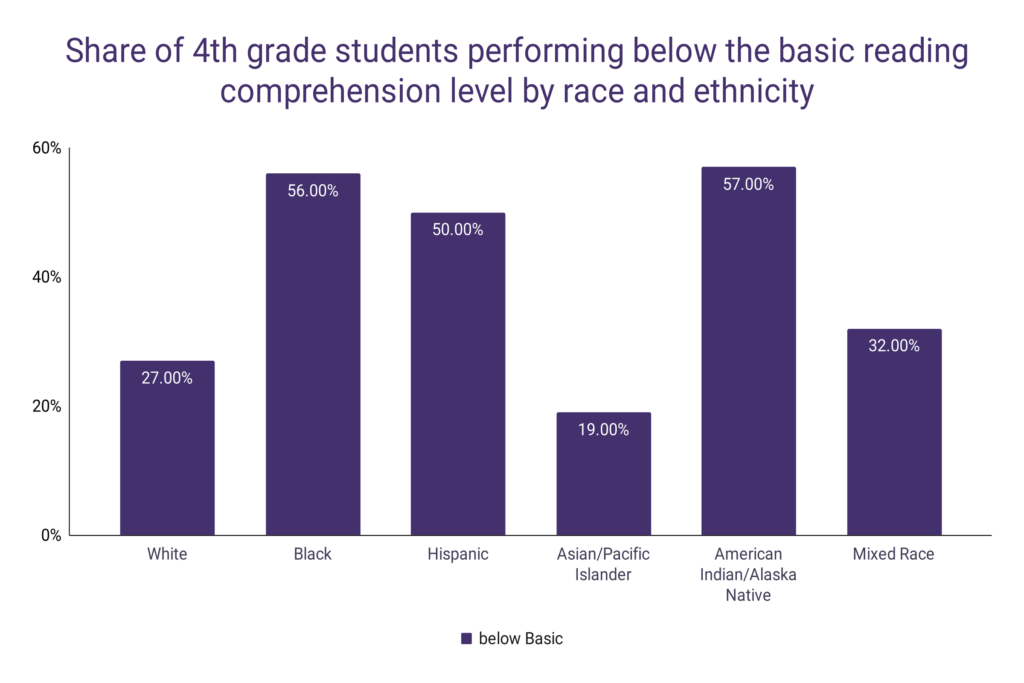
As of 2022, over 57.00% of American Indian students attending the 4th grade performed below the basic reading comprehension level according to NAEP’s standards.
56.00% of Black students performed below the basic reading comprehension standard, as well as half of all Hispanic 4th graders.
2022 was the first year in which 3 major racial/ethnic groups attending 4th grade have 50.00% of more students performing below the basic level of reading comprehension.
Among all groups, Asian students are the only ones with a reduced share of below the basic performers over the last 10 years.
Year
White
Black
Hispanic
Asian/Pacific Islander
American Indian/Alaska Native
Mixed Race
2022
27.00%
56.00%
50.00%
19.00%
57.00%
32.00%
2019
23.00%
52.00%
45.00%
19.00%
50.00%
28.00%
2017
22.00%
49.00%
46.00%
18.00%
52.00%
27.00%
2015
21.00%
48.00%
45.00%
18.00%
48.00%
27.00%
2013
21.00%
50.00%
47.00%
20.00%
49.00%
27.00%
2011
22.00%
51.00%
49.00%
20.00%
53.00%
27.00%
2009
22.00%
52.00%
51.00%
20.00%
50.00%
27.00%
2007
22.00%
54.00%
50.00%
23.00%
51.00%
28.00%
2005
24.00%
58.00%
54.00%
27.00%
52.00%
32.00%
2003
25.00%
60.00%
56.00%
30.00%
53.00%
31.00%
vs. 2013
29%
12%
6%
-5%
16%
19%
vs. 2003
8%
-7%
-11%
-37%
8%
3%
Share of 4th grade students performing below the basic reading comprehension levels by race and ethnicity
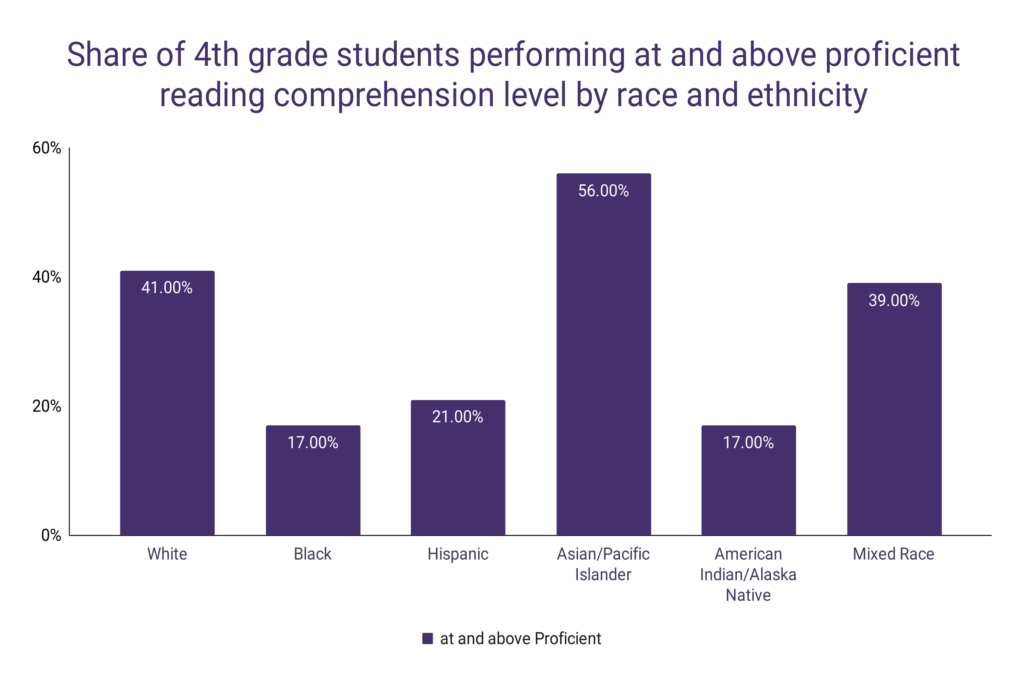
Over 56.00% of students of Asian origin attending the 4th grade performed at and above the proficient reading comprehension level in the 2022 assessment.
White students performed above the proficient level in 41.00% of cases, and 11% drop compared to the 2013 assessment.
Black and American Indian students (17.00%) have the lowest share of children at and above the proficient reading levels in the 4th grade.
All racial and ethnic groups, except Asian students, have a reduced share of students at and above the proficient reading level compared to 10 years ago.
Year
White
Black
Hispanic
Asian/Pacific Islander
American Indian/Alaska Native
Mixed Race
2022
41.00%
17.00%
21.00%
56.00%
17.00%
39.00%
2019
45.00%
18.00%
23.00%
54.00%
19.00%
40.00%
2017
47.00%
20.00%
23.00%
57.00%
20.00%
41.00%
2015
46.00%
18.00%
21.00%
54.00%
21.00%
40.00%
2013
46.00%
17.00%
20.00%
52.00%
21.00%
40.00%
2011
44.00%
16.00%
19.00%
49.00%
18.00%
39.00%
2009
42.00%
16.00%
18.00%
49.00%
20.00%
38.00%
2007
43.00%
14.00%
18.00%
46.00%
18.00%
35.00%
2005
41.00%
13.00%
16.00%
42.00%
18.00%
34.00%
2003
41.00%
13.00%
15.00%
39.00%
16.00%
33.00%
vs. 2013
-11%
0%
5%
8%
-19%
-2%
vs. 2003
0%
31%
40%
44%
6%
18%
Share of 4th grade students performing at and above proficient reading comprehension levels by race and ethnicity
Middle school reading performance by race and ethnicity
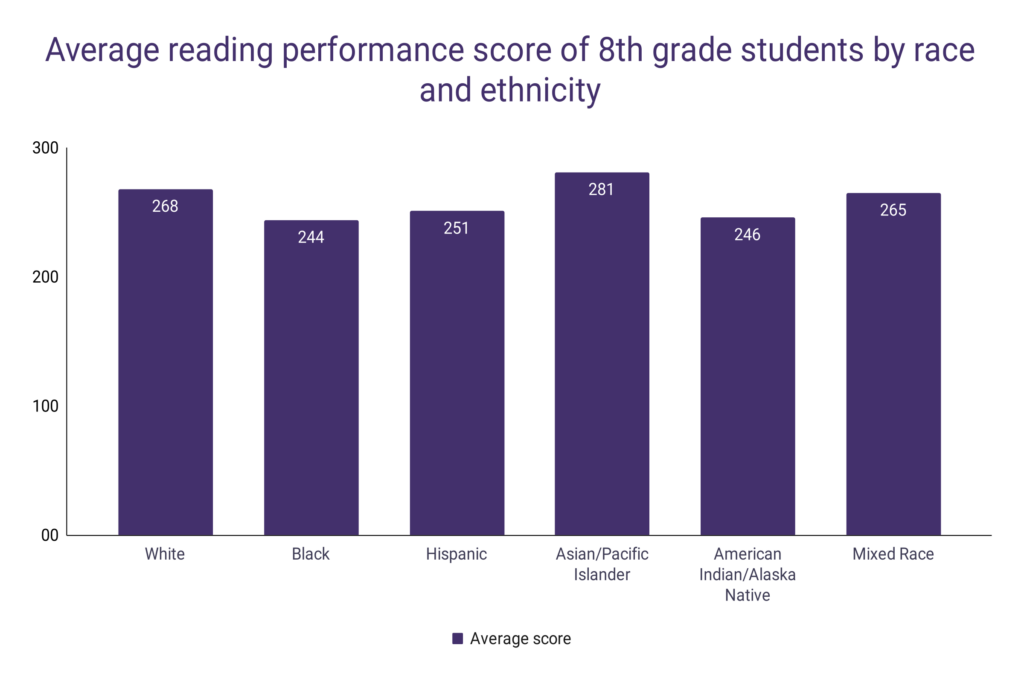
In the 2022 reading assessments for 8th grade students, Asian students showed the best overall performance, averaging 281 points on NAEP’s scale.
White students averaged 268 points, while mixed-race children averaged 265.
As with the 4th-graders, Black, Hispanic, and American Indian students have significantly worse overall reading performance in the 8th grade compared to the above-mentioned groups.
Also, all racial/ethnic groups, except Asian students, showed a decrease in reading performance over the last 10 and 20 years.
Year
White
Black
Hispanic
Asian/Pacific Islander
American Indian/Alaska Native
Mixed Race
2022
268
244
251
281
246
265
2019
272
244
252
281
248
267
2017
275
249
255
282
253
272
2015
274
248
253
280
252
269
2013
276
250
256
280
251
271
2011
274
249
252
275
252
269
2009
273
246
249
274
251
267
2007
272
245
247
271
247
265
2005
271
243
246
271
249
266
2003
272
244
245
270
246
266
Average reading performance score of 8th grade students by race and ethnicity
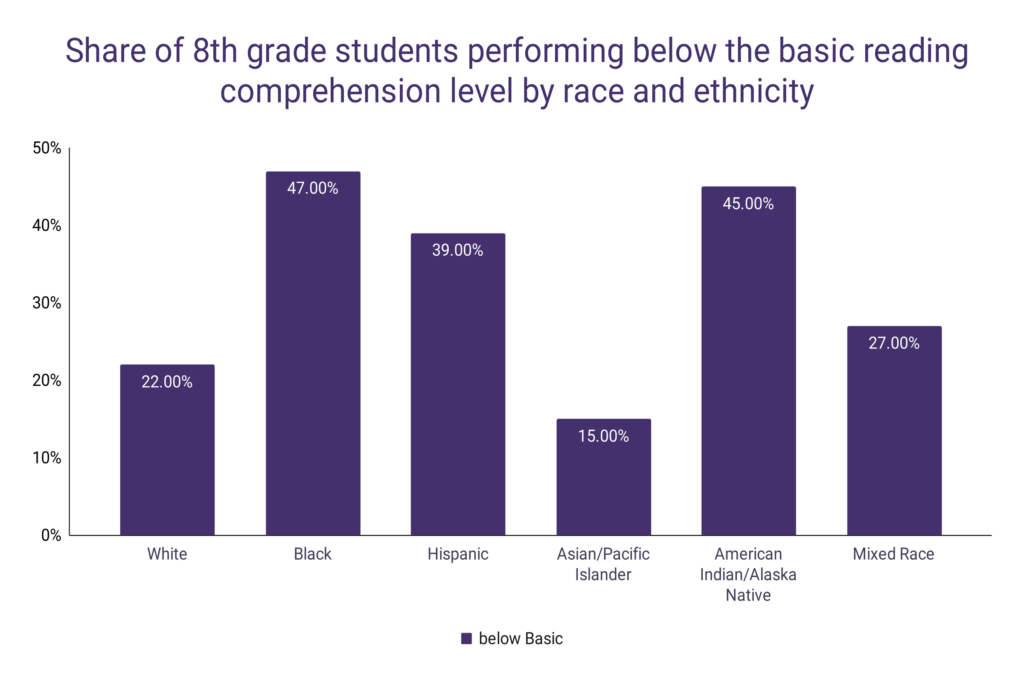
As opposed to the 4th-grade reading assessment, no racial/ethnic groups have over 50.00% of students performing below the basic reading comprehension level as of 2022.
Black students (47.00%) and American Indian students (45.00%) are close to the 50.00% mark.
On the other hand, only 15.00% of students of Asian origin performed below the basic reading comprehension level in the 8th grade as of 2022.
Over the last 10 years, all racial and ethnic groups of 8th-graders have an increased share of students performing below the basic reading levels, with the biggest increase noticed in White students (57.00%).
Year
White
Black
Hispanic
Asian/Pacific Islander
American Indian/Alaska Native
Mixed Race
2022
22.00%
47.00%
39.00%
15.00%
45.00%
27.00%
2019
18.00%
46.00%
37.00%
15.00%
41.00%
24.00%
2017
16.00%
40.00%
33.00%
14.00%
37.00%
18.00%
2015
15.00%
42.00%
34.00%
14.00%
37.00%
21.00%
2013
14.00%
39.00%
32.00%
14.00%
38.00%
19.00%
2011
15.00%
41.00%
36.00%
17.00%
37.00%
21.00%
2009
16.00%
43.00%
39.00%
17.00%
38.00%
22.00%
2007
16.00%
45.00%
42.00%
20.00%
44.00%
24.00%
2005
18.00%
48.00%
44.00%
20.00%
41.00%
24.00%
2003
17.00%
46.00%
44.00%
21.00%
43.00%
22.00%
vs. 2013
57%
21%
22%
7%
18%
42%
vs. 2003
29%
2%
-11%
-29%
5%
23%
Share of 8th grade students performing below the basic reading comprehension levels by race and ethnicity
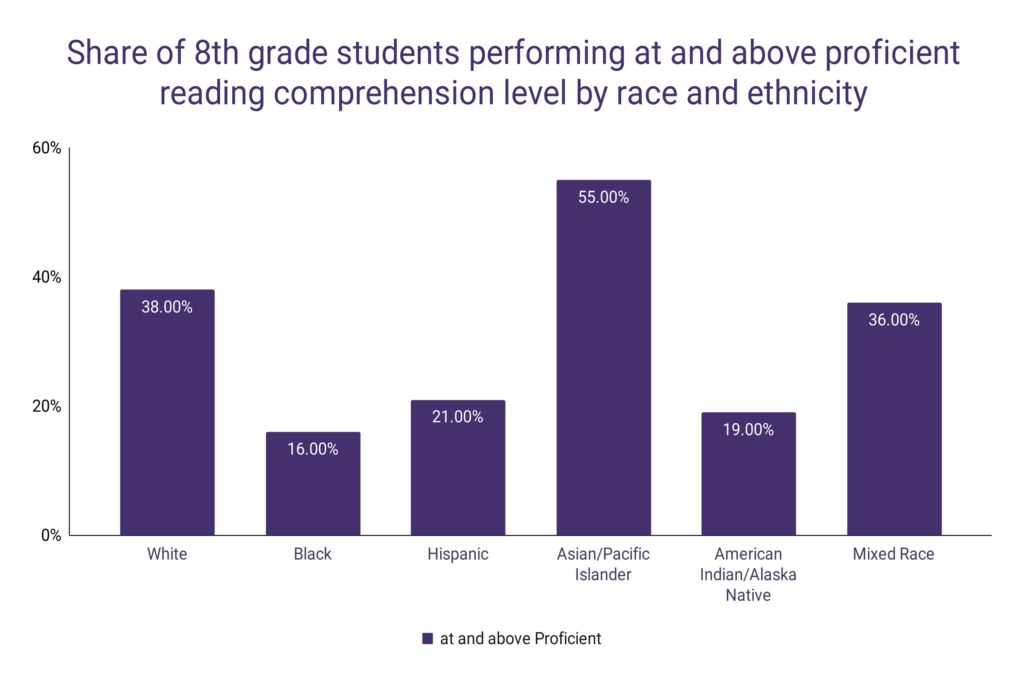
Over 55.00% of Asian students attending the 8th grade in US schools performed at and above the proficient reading comprehension level, according to NAEP’s assessment.
No other racial/ethnic group has over 40.00% of students performing at this level as of 2022.
Only 16.00% of Black 8th-graders are at and above the proficient reading level, as well as 19.00% of American Indian students.
Compared to the 2013 assessment, 17.00% fewer White students are performing above the proficient reading level, the biggest drop among all racial and ethnic groups.
Year
White
Black
Hispanic
Asian/Pacific Islander
American Indian/Alaska Native
Mixed Race
2022
38.00%
16.00%
21.00%
55.00%
19.00%
36.00%
2019
42.00%
15.00%
22.00%
54.00%
19.00%
37.00%
2017
45.00%
18.00%
23.00%
55.00%
21.00%
42.00%
2015
44.00%
16.00%
21.00%
52.00%
22.00%
38.00%
2013
46.00%
17.00%
21.00%
52.00%
19.00%
40.00%
2011
43.00%
15.00%
19.00%
47.00%
22.00%
39.00%
2009
42.00%
13.00%
17.00%
45.00%
21.00%
34.00%
2007
40.00%
12.00%
16.00%
41.00%
18.00%
34.00%
2005
39.00%
12.00%
15.00%
41.00%
17.00%
36.00%
2003
41.00%
13.00%
16.00%
40.00%
17.00%
33.00%
vs. 2013
-17%
-6%
0%
6%
0%
-10%
vs. 2003
-7%
23%
31%
38%
12%
9%
Share of 8th grade students performing at and above proficient reading comprehension levels by race and ethnicity
High school reading performance by race and ethnicity
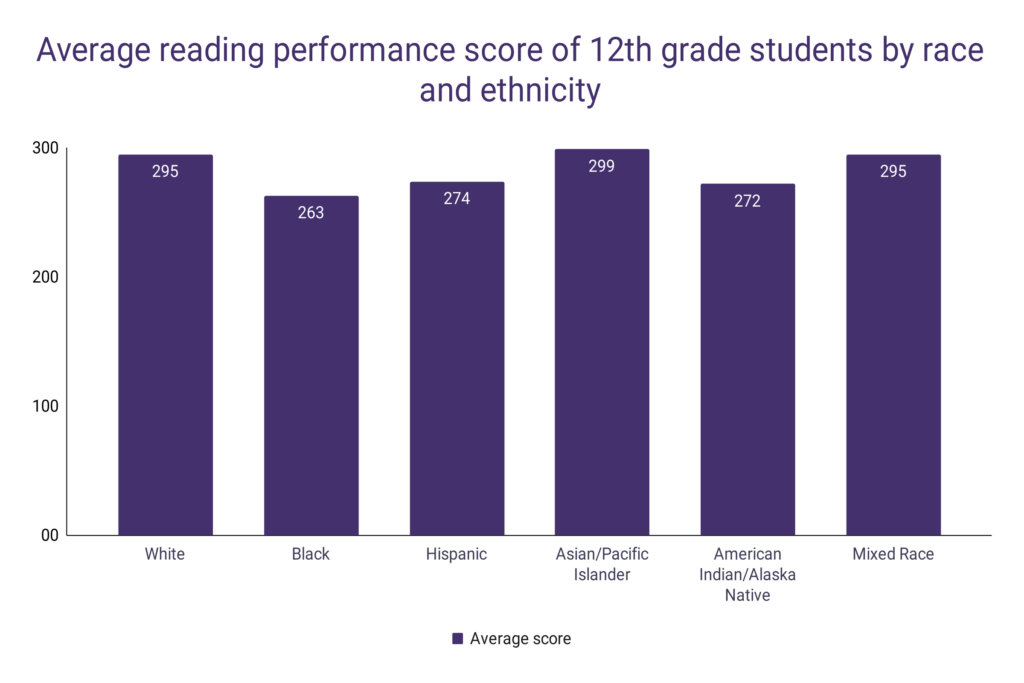
As with elementary and middle school reading statistics, Asian students attending 12th grade are the best performers among all major racial and ethnic groups regarding reading ability, averaging 299 points in the 2019 assessment.
White and mixed-race students are close by, with 295 points on average.
Black students showed the worst reading performance results in 2019, averaging 263 points.
Only Asian and mixed-race students improved their average reading performance since 2013, while all other groups significantly declined.
Year
White
Black
Hispanic
Asian/Pacific Islander
American Indian/Alaska Native
Mixed Race
2019
295
263
274
299
272
295
2015
295
266
276
297
279
295
2013
297
268
276
296
277
291
2009
296
269
274
298
283
298
2005
293
267
272
287
279
283
Average reading performance score of 12th grade students by race and ethnicity
Among the 12th-graders, only Black students have 50.00% or more people performing below the basic reading comprehension level as of 2019.
This was also the first time that one racial group of students attending 12th grade had 50.00% or more people performing below the basic reading levels.
Only mixed-race students have a smaller share of people below the basic reading comprehension levels compared to the 2013 assessment, with White students increasing the share of below-the-basic performers by 24.00%.
Year
White
Black
Hispanic
Asian/Pacific Islander
American Indian/Alaska Native
Mixed Race
2019
21.00%
50.00%
39.00%
22.00%
41.00%
22.00%
2015
21.00%
48.00%
37.00%
21.00%
35.00%
21.00%
2013
17.00%
44.00%
36.00%
20.00%
35.00%
23.00%
2009
19.00%
43.00%
39.00%
19.00%
30.00%
17.00%
2005
21.00%
46.00%
40.00%
26.00%
33.00%
27.00%
vs. 2013
24%
14%
8%
10%
17%
-4%
vs. 2005
0%
9%
-3%
-15%
24%
-19%
Share of 12th grade students performing below the basic reading comprehension levels by race and ethnicity
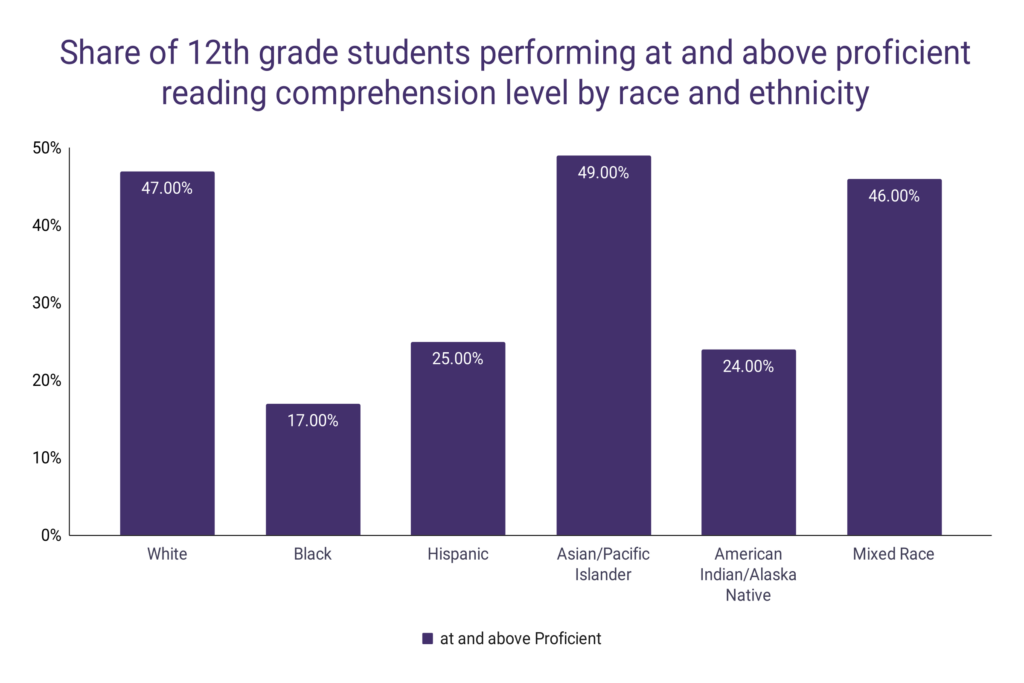
49.00% of Asian students attending 12th grade performed at and above the proficient reading level as of 2019, the most among all racial groups.
On the other hand, only 17.00% of Black students performed at this level, the least among all groups.
Since 2013, mixed-race students have the biggest gain in terms of share of above-the-proficient performers in the 12th grade, with 21.00%.
On the other hand, there are 8.00% fewer American Indian students above the proficient level over this period, the only group with a decline.
Year
White
Black
Hispanic
Asian/Pacific Islander
American Indian/Alaska Native
Mixed Race
2019
47.00%
17.00%
25.00%
49.00%
24.00%
46.00%
2015
47.00%
16.00%
25.00%
48.00%
28.00%
45.00%
2013
47.00%
16.00%
24.00%
47.00%
26.00%
38.00%
2009
46.00%
17.00%
22.00%
49.00%
29.00%
48.00%
2005
43.00%
16.00%
20.00%
36.00%
26.00%
29.00%
vs. 2013
0%
6%
4%
4%
-8%
21%
vs. 2005
9%
6%
25%
36%
-8%
59%
Share of 12th grade students performing at and above proficient reading comprehension levels by race and ethnicity