This is a comprehensive analysis of the current state of public libraries in the US and the mapping of trends from 1992-2019. This report analyzes more than 12.5 million data points from all 50 states and nearly 17,500 libraries across the country.
With the latest reports, we were able to examine the impact of Covid-19 on public libraries in the US.
Key Findings
Why people think “libraries are dying”
- Visits to libraries in a 10-year decline (21.20% since 2009) while people borrow fewer books (19.21% less than in 2013).
Libraries are more popular than ever thanks to the strong shift to digital:
- More registered borrowers than ever (174.23 million, or 53.57% of the population)
- The total library collection size is larger and more digital than ever (58.75% of the collection)
- Library collection use is higher and more digital than ever (37.39% of all collection use)
More library programs (6 million) and higher program attendance (125 million) than ever:
- Library program attendance now accounts for 10.01% of all visits to libraries, up 84% from 2009
- States with the most programs per capita have more visits (88.25%), collection use (51.31%), and registered borrowers (12.21%) than states with least programs per capita
It’s never been more expensive to operate a library
- Average operating expenses per library is $765,715 up more than 17.00% since 2014
- Libraries costs are more administrative than ever – 89.18% spent on staff and other expenses vs only 10.82% on library collections
Government funding hasn’t covered library operating expenses since 1992
- Libraries would be in a $4.38 billion deficit if relying on government funding alone
- Other Income from donations, grants, fines, and fees addressed budget deficits and helped generate a $17.05 billion budget surplus
- Highest-funded states per capita have more visits (80.99%), collection use (122.49%), programs (73.31%), and program attendance (81.76%) than the lowest-funded states
- There’s never been more libraries (17,468) or librarians (51,190), but library staff is still paid 35.07% below a livable wage for a family of three on average.
Why people think “libraries are dying”
A common question is whether or not libraries are dying or becoming obsolete. Before highlighting why that is not true, we wanted to highlight where these misconceptions come from
- A decline in visits to libraries
- A decline in books and other physical collections being borrowed from libraries
Visits in a 10-year decline
As a staple in American communities, the number of people visiting their local libraries had reached 1.59 billion in 2009, having grown 34.52% since 1992.
Ever since its peak in 2009, the number of visitors has steadily decreased, dropping by 21.20% to 1.25 billion visits in 2019.
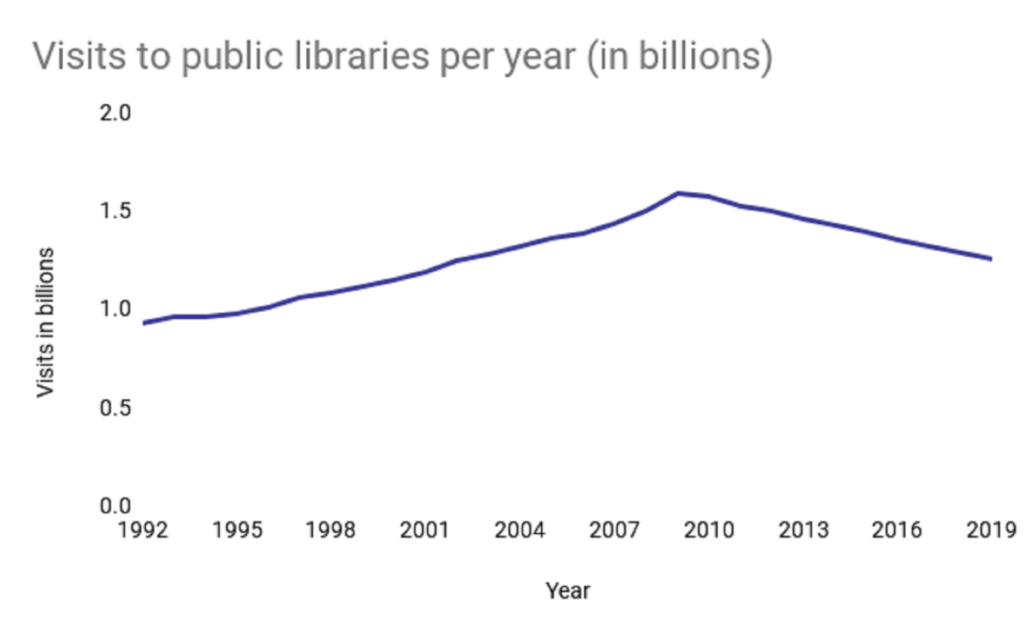
Now there are an average of 3.85 visits to libraries per person in the US, a 14.81% decrease from 2014.
| One reason why libraries are so great is that they allow you to read books and expand your vocabulary. They also often have computers that allows you to go online and play games like Wordle, Scrabble or Words with Friends. |
People are borrowing fewer books
In addition to fewer people visiting libraries, fewer and fewer books are being borrowed each year as seen by the 19.21% decrease in physical collection use to 1.83 billion in 2019.
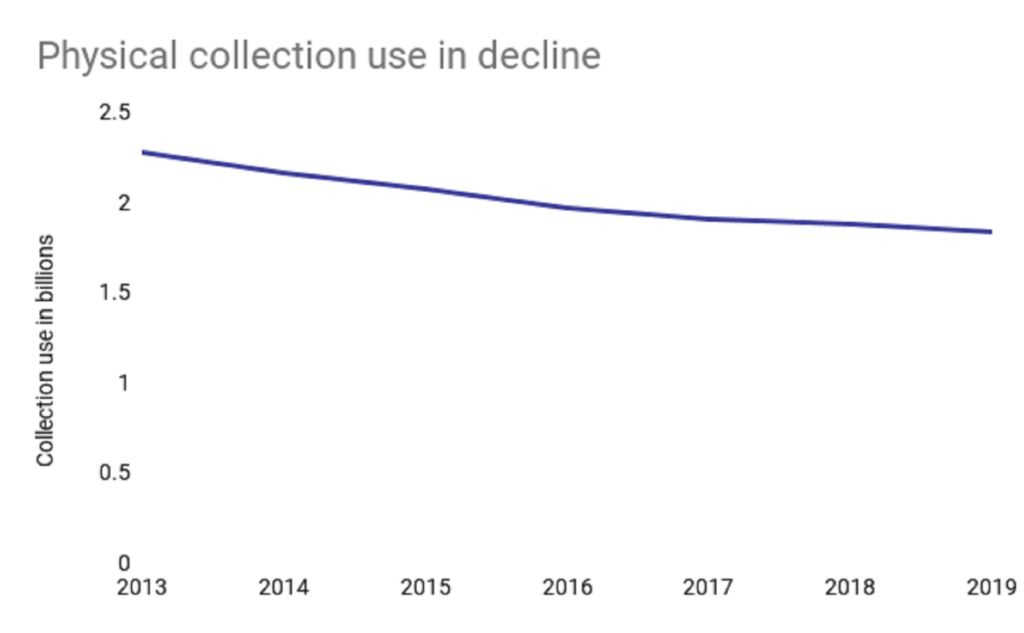
The logic seems simple enough, less people are going to the library and there are fewer books being borrowed, so “libraries must be dying”, when in fact, libraries have never been more popular.
Libraries are more popular than ever
Using just visits and materials borrowed to assess libraries is outdated as the role of libraries and how they serve their communities is evolving. This is because it fails to account for how libraries are evolving to serve their communities digitally, while also evolving how they make use of their physical space.
Total collection use reaches record highs
A library collection consists of all digital and physical materials it has to offer to its members. How much of that collection is borrowed or used is known as total library collection use.
Despite the decrease in physical collection use, total library collection use reached a record high of 2.98 billion in 2019, growing 15.96% since 2013.
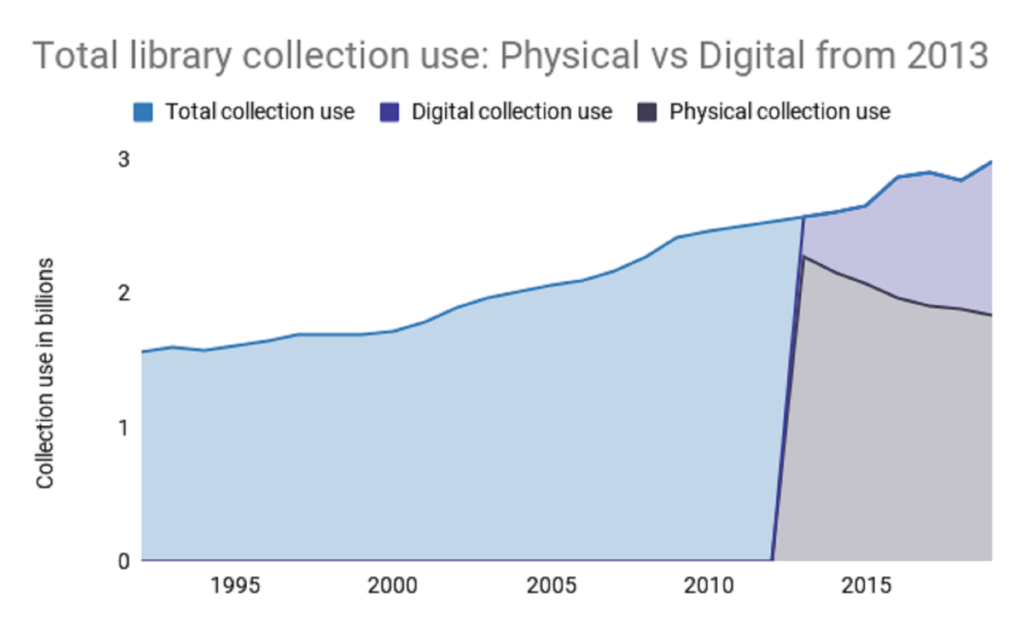
This is due to the 153.16% growth in digital collection use from 302 million in 2013 to 1.15 billion in 2019.
More Americans are registered borrowers at public libraries than ever
There were 174.23 million registered borrowers as of 2019, the highest ever.
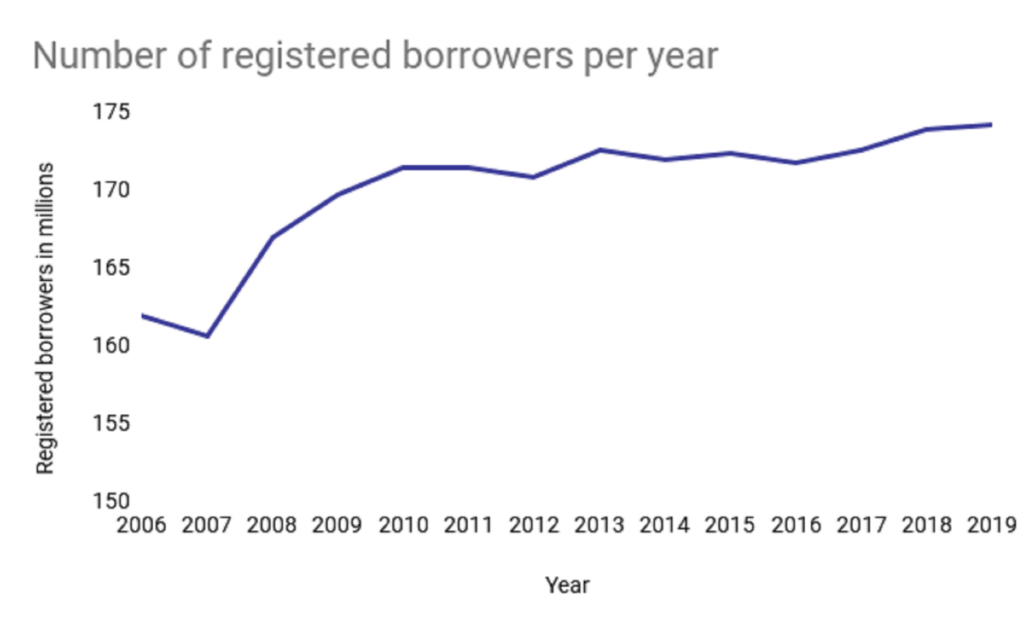
This means 53.52% of all Americans are registered borrowers at a public library.
The number of registered borrowers has been consistently growing, increasing 7.60% since they began measuring this metric in 2006.
Registered borrowers are more active than ever
The 174.23 million registered borrowers at public libraries had an average collection use of 16.85 items in 2019, up 10.77% from 2014.
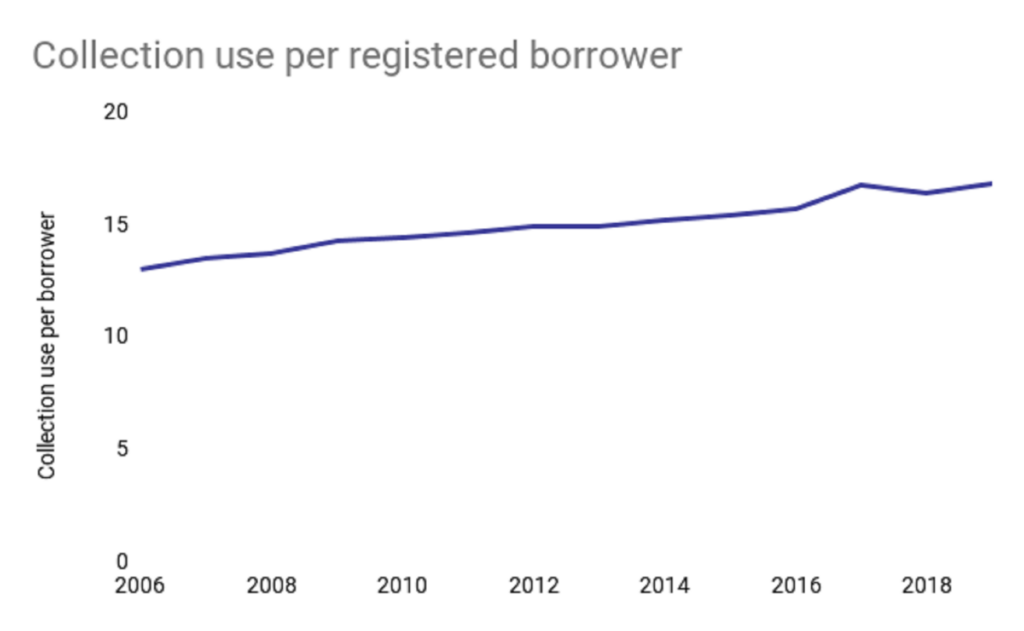
Between collection use and the number of registered borrowers being higher than ever, it’s clear that libraries are not “dying”; libraries are evolving as they continue a strong shift to digital, providing more content digitally and finding new ways to use the physical space of libraries.
Library collections are larger and more digital than ever
The total collection size at public US libraries grew 113.34% since 2009, reaching its peak of 1.88 billion in 2018, before stabilizing at 1.77 billion in 2019.
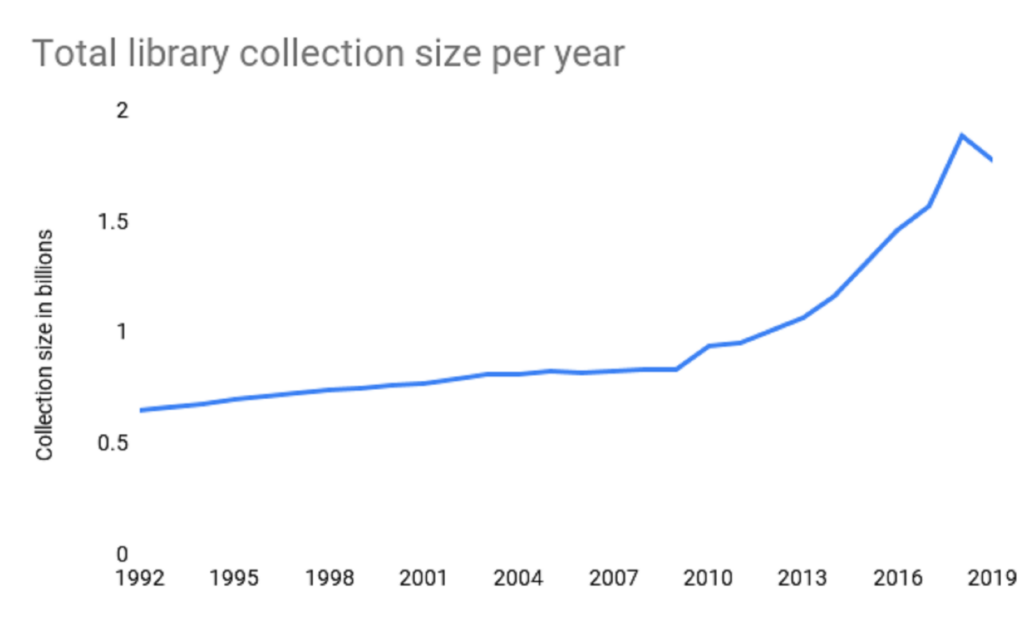
Library collections are now more digital than ever, with digital collections accounting for more than half of all collections in 2018 (56.28%) and 2019 (54.75%).
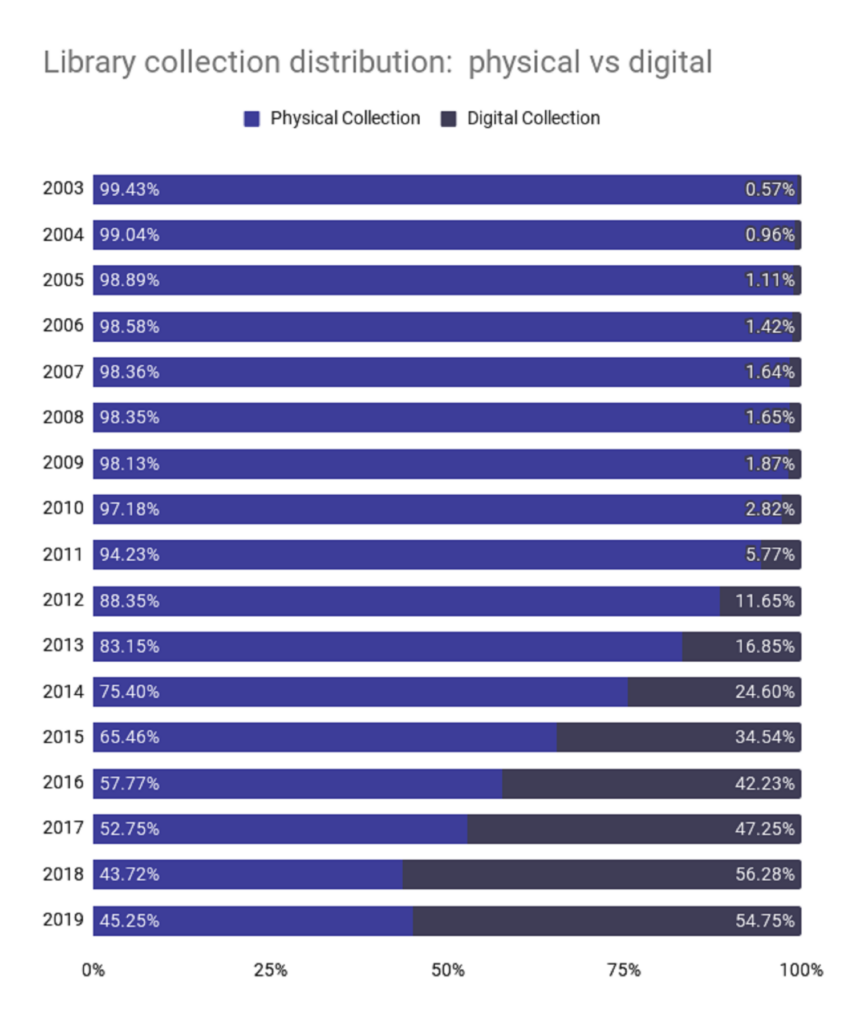
Just 10 years ago in 2009, physical items like books, magazines, newspapers, and physical video and audio materials accounted for 98.13% of library collections, being cut in more than half down to just 45.25% in 2019.
Collection size by format
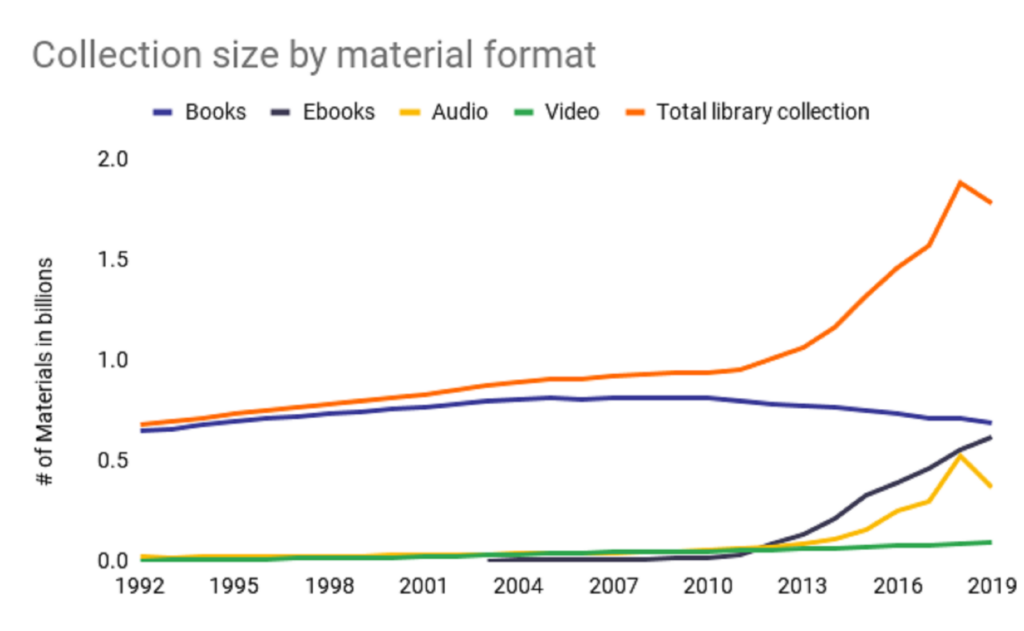
The number of books in library collections reached its peak of 816 million in 2008. It then began a steady decline, dropping 15.08% to 693 million books in 2019.
When the period of decline for books began in 2008, ebooks began to take off in growth, followed by audiobooks.
For the first time ever, ebooks account for more than a third of all library collections (35%) while books have declined from 91% in 2003 to 39% in 2019.
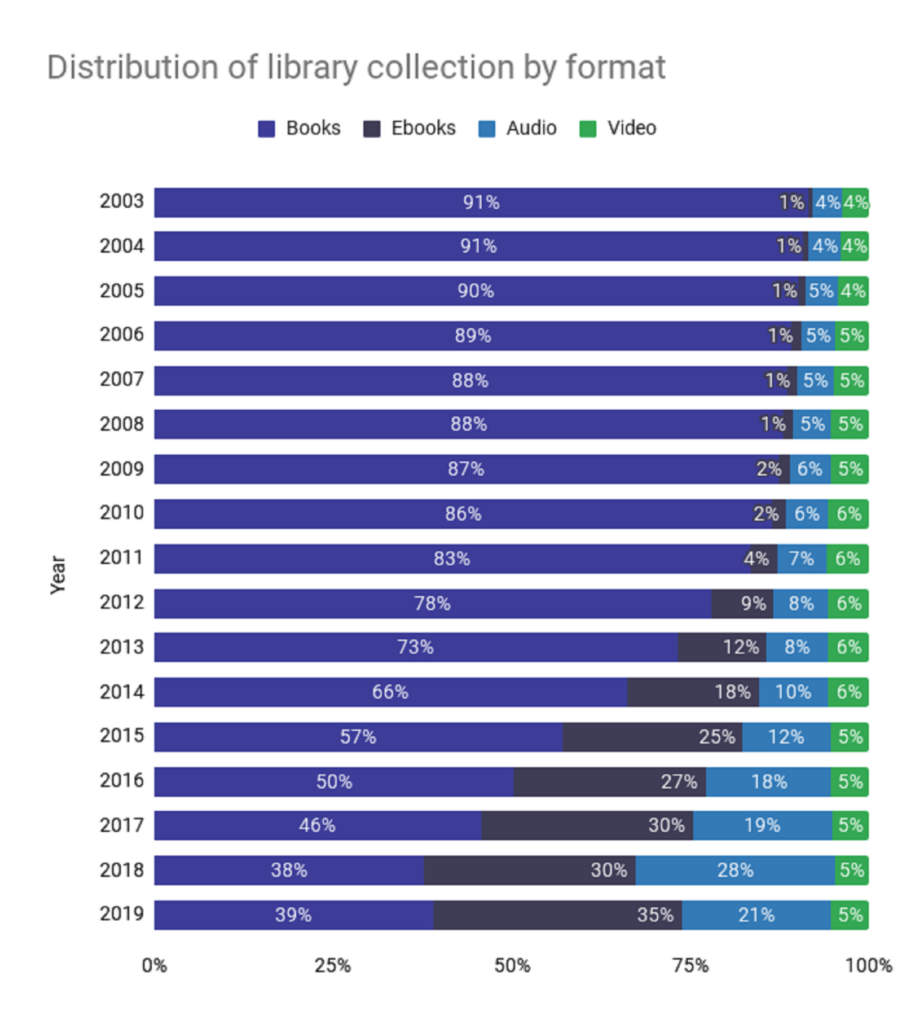
Both physical and digital audio materials account for more than a fifth of all collections (21%) while videos have consistently remained in the 4% – 6% range.
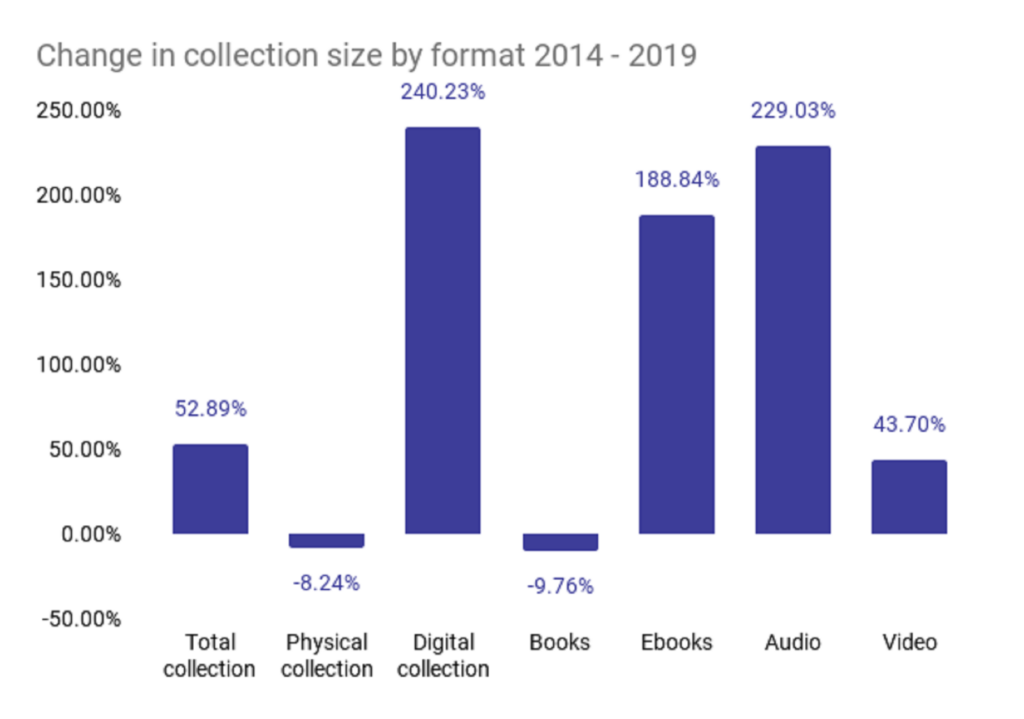
On a per-capita basis, the total collection size has increased 48.10% from 2014 to 2019. During this time period, books experienced a decline, while all other formats increased.
| Years | Total collection | Physical collection | Digital collection | Books | Ebooks | Audio | Video |
| Change from 2009 – 2019 | 113.34% | -1.63% | 6159.57% | -15.07% | 3978.45% | 596.25% | 89.43% |
| Change from 2014 – 2019 | 52.89% | -8.24% | 240.23% | -9.76% | 188.84% | 229.03% | 43.70% |
| Total size in 2019 | 1.77 billion | 804.30 million | 973.15 million | 692.97 million | 617.86 million | 368.21 million | 96.37 million |
Collection use is more digital than ever
Digital collection use accounts for more of total collection use than ever (37.39%), having more than tripled since 2013 (11.74%).
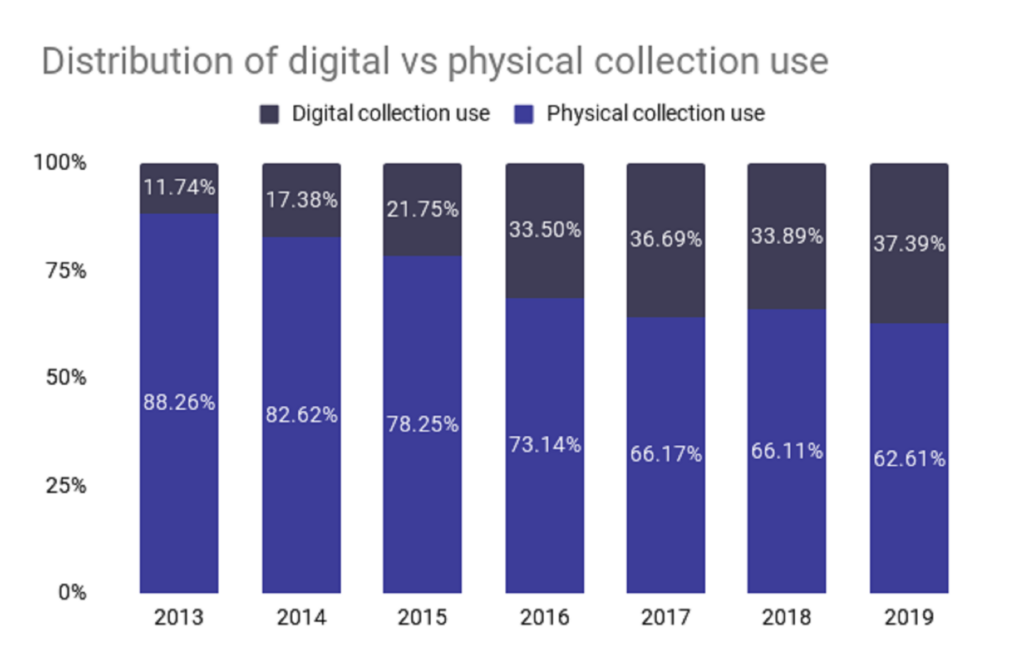
Meanwhile, physical collection use has dropped to accounting for only 62.61% of all collection use, down from 88.26% in 2013.
Digital collection use up 121.64% while physical collection use in decline
In 2019, the average collection use per person reached 5.45 in 2019, up 48.03% from 3.68 in 2014.
Driving that growth is the 145.11% increase in digital collection use per capita from 1.44 in 2014 to 3.53 in 2019. Which makes up for the 17.68% decrease in physical collection use per capita during that same time period.
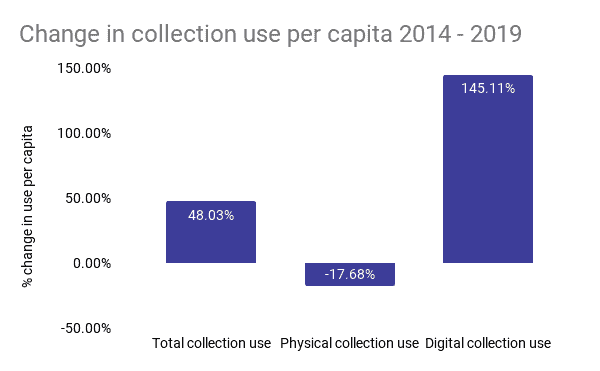
Despite these overall trends, physical items like books and magazines are still used the most. The number of physical collection items borrowed per capita (5.63) is 59.65% greater than digital collection use per capita (3.53).
| Year | Total collection use per capita | Physical collection use per capita | Digital collection use per capita |
| 2013 | 3.39 | 7.25 | 0.96 |
| 2014 | 3.68 | 6.84 | 1.44 |
| 2015 | 4.14 | 6.53 | 1.82 |
| 2016 | 4.56 | 6.15 | 2.82 |
| 2017 | 4.87 | 5.93 | 3.12 |
| 2018 | 5.81 | 5.80 | 2.97 |
| 2019 | 5.45 | 5.63 | 3.53 |
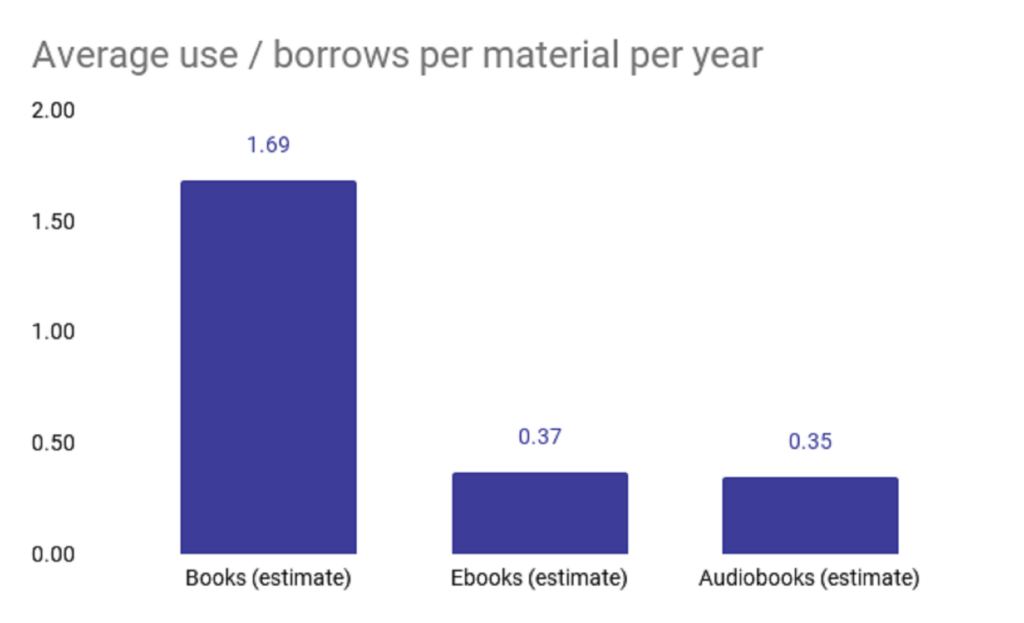
Average use / borrows per material per year
Each book in a library’s collection is borrowed an average of 2.29x per year. That’s 518.92% more than ebooks (0.37x per year) and 554.29% more than audiobooks (0.35x per year).
Note: How average borrows of books, ebooks, and audiobooks were estimated
- Ebooks & audiobooks
- We estimated that 2/3rd of the digital materials borrowed were ebooks and 1/3rd audiobooks given that
- Ebooks make up ~63.49% of all borrowable electronic materials and audiobooks make up 33.62%
- Overdrive Rakuten, an industry-leading digital book and media provider for public libraries stated that 67.65% of digital books borrowed were ebooks and 32.23% were audiobooks in 2018, with audiobooks growing at a faster yearly pace than ebooks
- Books
- Books account for 86.15% of the physical material collection at libraries. Therefore, we estimated that books accounted for 86.15% of all physical collection use.
- We believe this to be a conservative estimate, based on assumptions that physical books are likely to be borrowed more frequently than other physical materials such as newspapers, periodicals, magazines, physical video and audio materials
More library programs and higher program attendance than ever
As libraries continue integrating, using, and providing digital solutions, the physical space has the opportunity to evolve and be used for other means.
One primary way of doing this has been through offering greater diversity and depth to their programming offerings. Using these as opportunities to serve and engage with more people in their communities.
More library programs than ever
There were a total of 5.925 million programs run at public libraries in 2019. The number of programs has more than doubled since 2004 (128.00% increase) and has increased 32.09% since 2014.

Kids programs account for 3.136 million programs held at libraries in 2019, up 21.87% from 2.573 million in 2014.
Programs for young adults reached a peak of .596 million programs in 2019. Although there are more than 4x kids programs, young adults programs are growing at a faster rate of 40.65% from 2014.
The US averages 9.63 library programs per 1,000 people. the average library ran 31.44% more programs per year in 2019 (339.24) in comparison to 2014 (258.10).
Library program attendance continues to grow to new highs
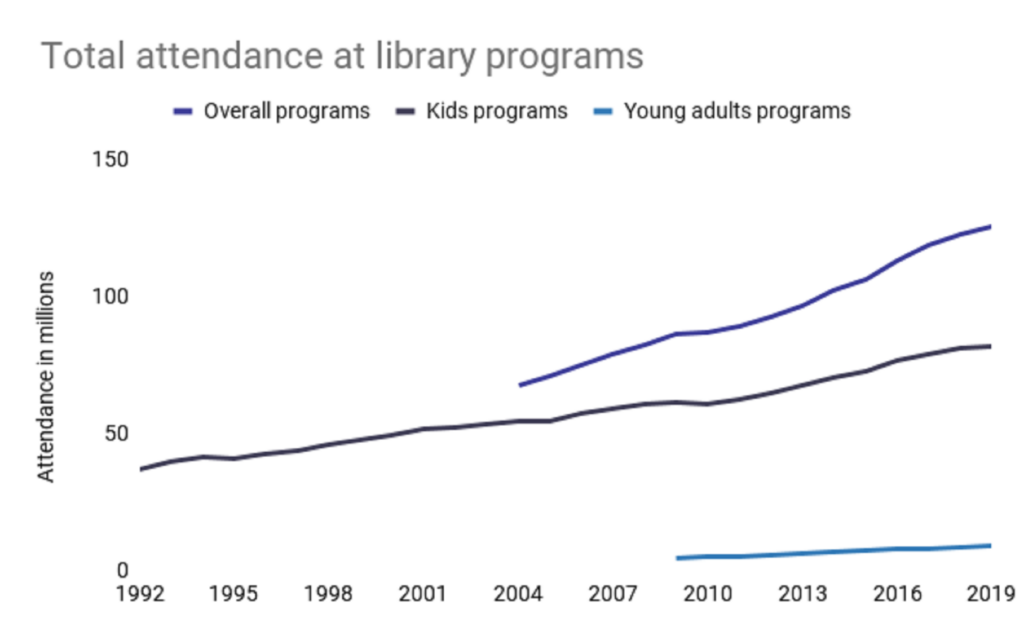
More people are attending programs at their public library than ever before. Total program attendance reached 125.55 million in 2019, up 23.06% since 2014 and nearly doubled since 2004.
On average, 21.19 people attend each library program at US public libraries.
Attendance at programs for:
- Kids reached 81.84 million in 2019, up 16.57% from 2014
- Young adults reached 8.89 million in 2019, up 32.79% from 2014.
Library program attendance accounts for more visits than ever
Although overall visits to libraries are in decline, the same is not true for program attendance.
Program attendance now accounts for a total of 10.01% of all visits to libraries, up 84% from 2009.
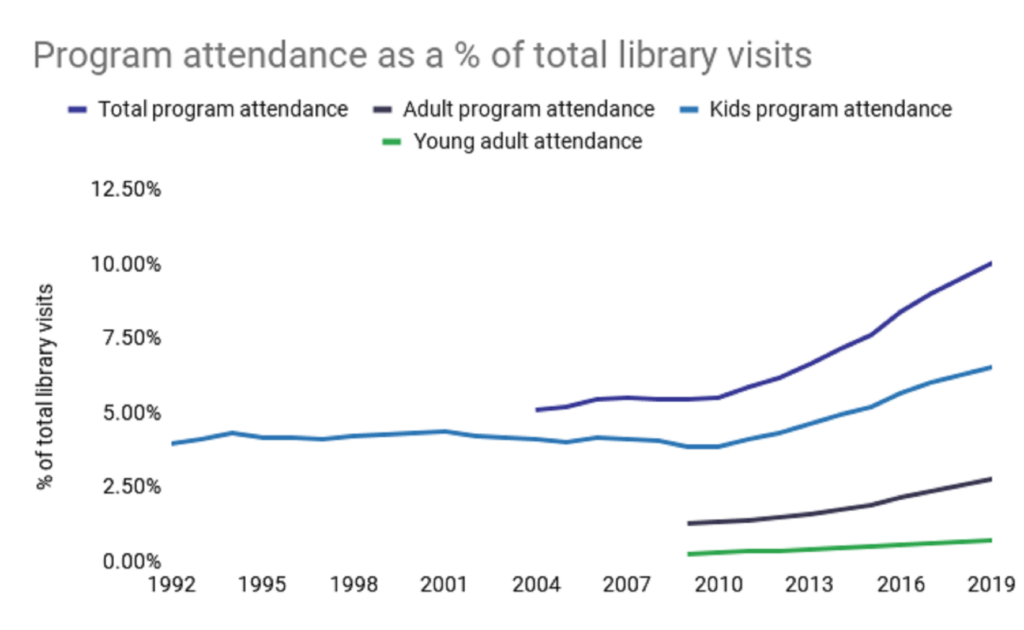
The rising of program attendance accounting for more than a tenth of all visits suggests that library programs are playing an increasingly larger role in how libraries plan to operate. Providing a greater depth and diversity of programs that allow libraries to connect with and address the needs of more people in their community.
Library programs drive visits and circulation
We already know that running more programs is strongly associated with greater program attendance. But in addition to that, running more programs may significantly increase a libraries visits per capita and circulation per capita.
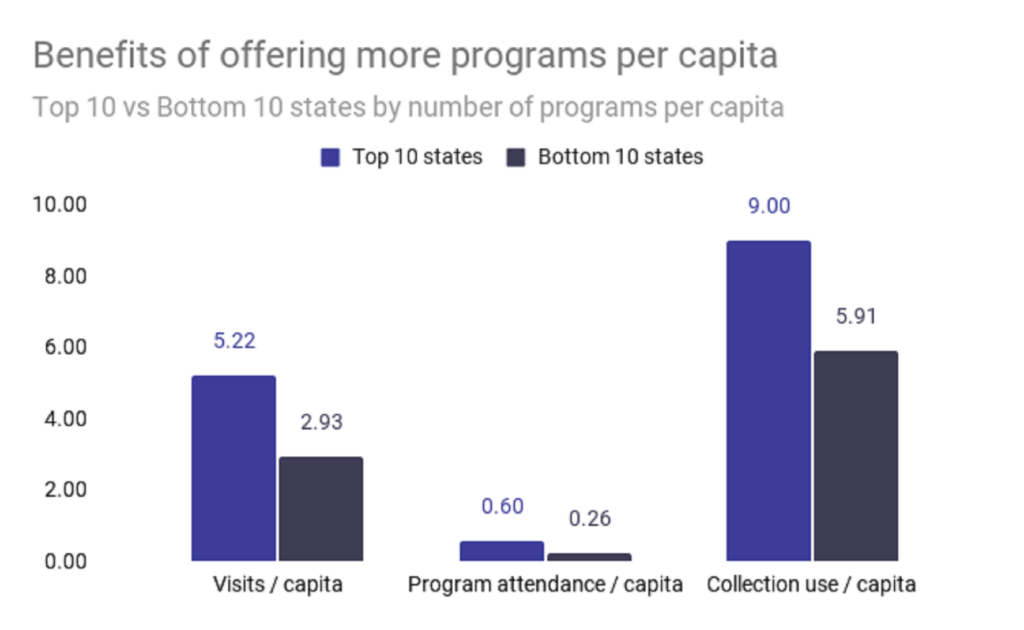
In comparison to the bottom 10 states, the top 10 states by the number of programs per capita have:
- 77.81% higher visits per capita
- 133.91% higher program attendance per capita
- 52.31% higher collection use per capita
Greater program attendance per capita also has positive benefits for libraries.
In comparison to the bottom 10 states, the top 10 states for program attendance per capita had:
- 88.25% higher visits per capita
- 12.21% more registered borrowers per capita
- 28.95% higher collection use per capita
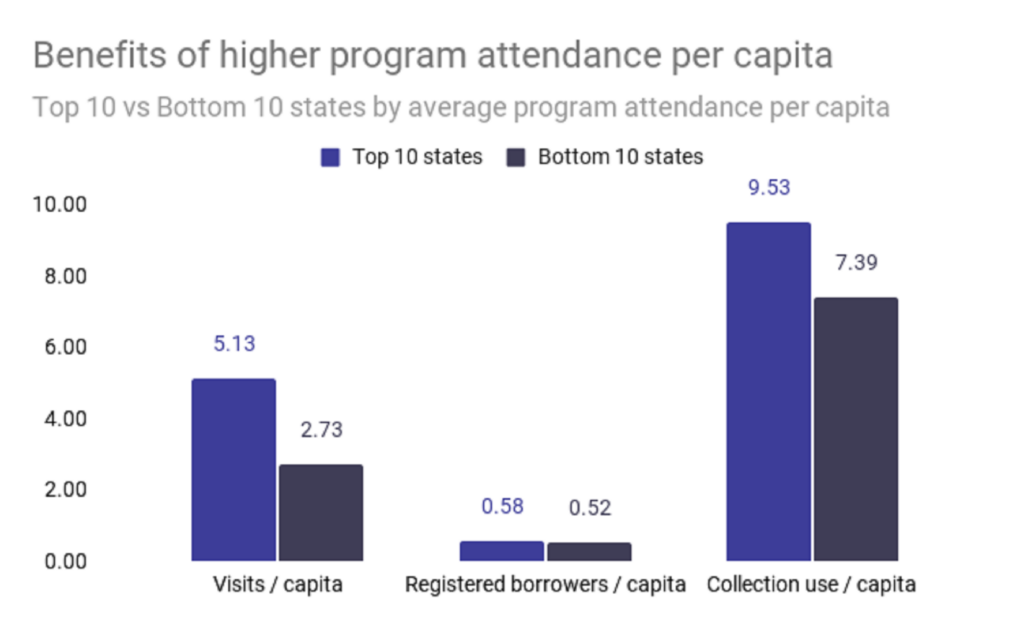
The trend points to benefits to libraries that offer more programs per capita and higher program attendance per capita, specifically in greater visits, collection use, and even registered borrowers.
Libraries address the technology gaps in communities
In addition to the vast collection of materials and programs, libraries also play an important role in meeting the technology needs of their communities. One of the most basic technology needs in this day and age is access to a computer and the internet.
Libraries have been continually stepping up to fill that technology gap in communities through access to 224 million people who logged a session on their 300,338 available computers.
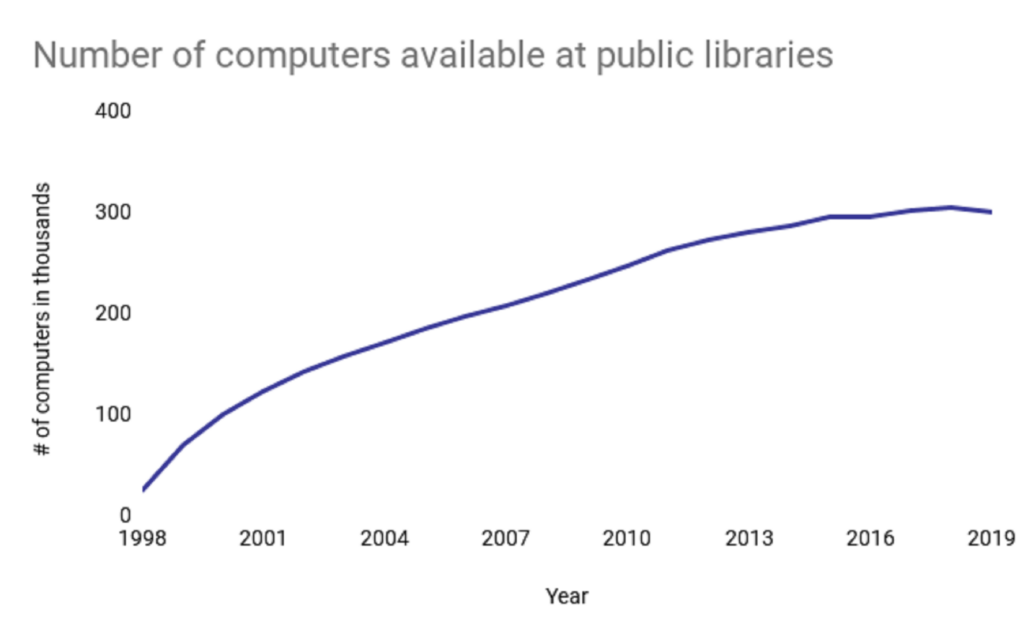
The number of computers at libraries grew 332.60% since 2009 until it stalled out and experienced its first decline from 2018 to 2019.
This decline in computers may be due to the 30.40% decline in computer users, lowering the demand for having as many actual computer stations. In that same time period though, the number of WiFi sessions increased 234.54% to nearly 500 million sessions.
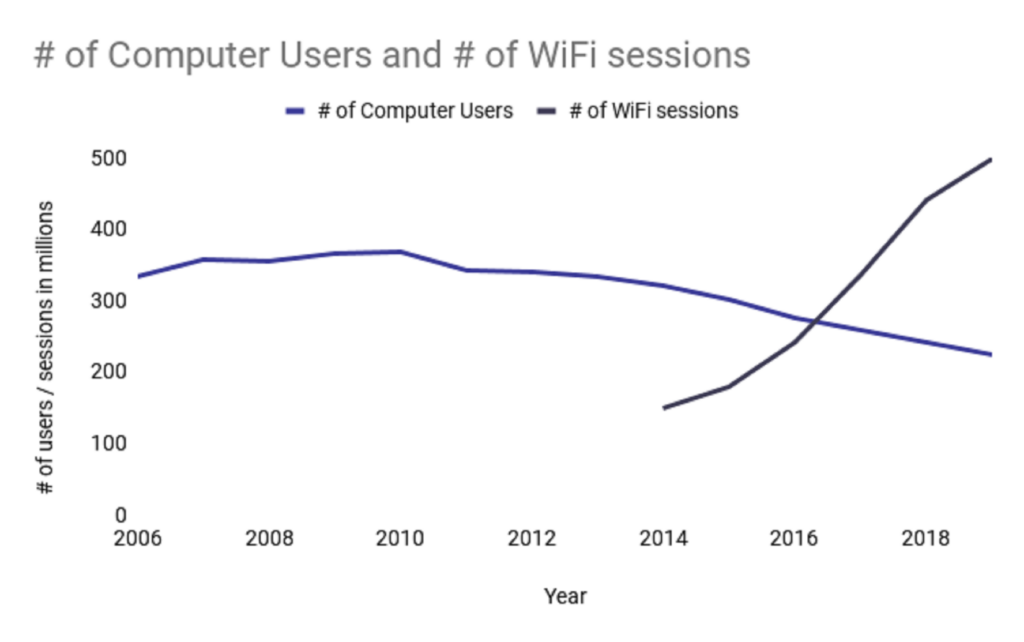
Libraries are ensuring that the basic technological needs of their communities are met through computer and internet access.
Libraries will continue meeting these basic technological needs while also meeting a new, wide range of technology gaps, with libraries offering everything from maker spaces (3D printing), audio and video design studios, web design & development software, or even gaming platforms.
Never been more expensive to operate a library
It has never been more expensive to run a public library in the US. Total operating expenses reached $13.37 billion in 2019.
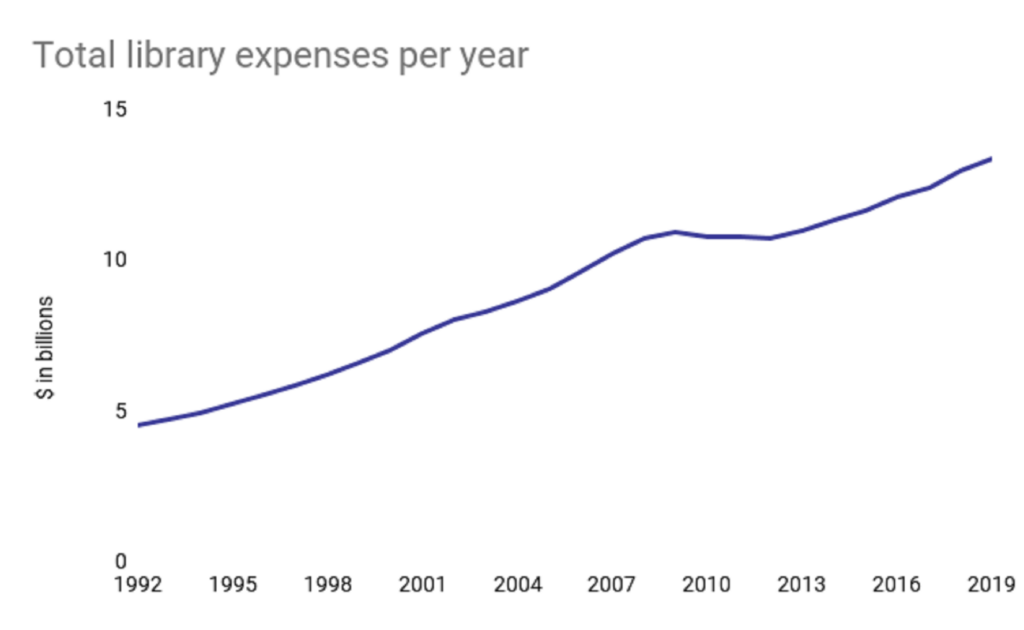
The Total operating expenses of an average library is $765,715.23, which is up 17.35% since 2014.
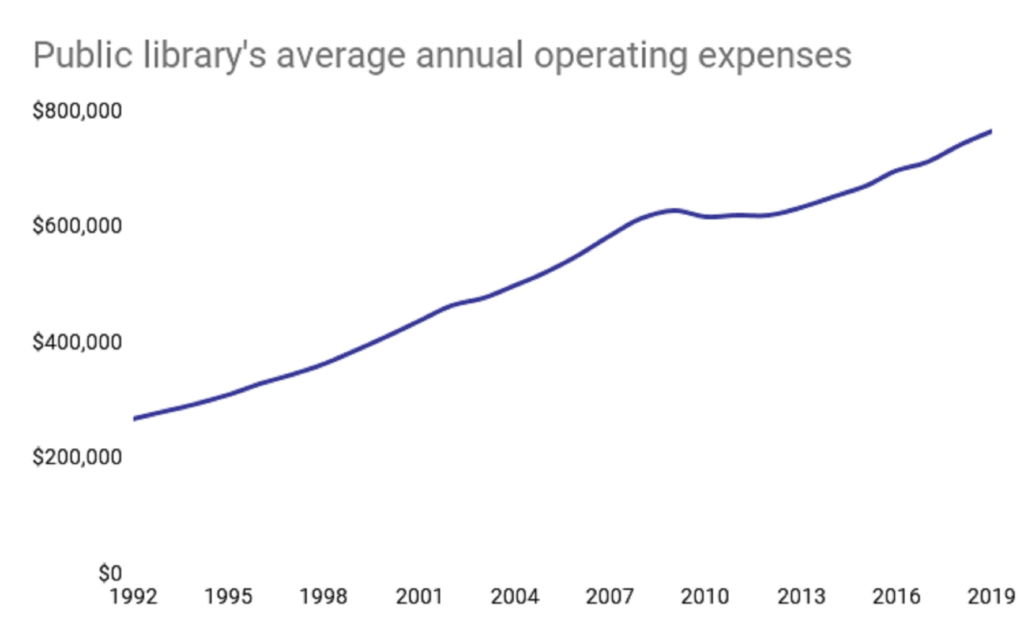
The price of operating a library has doubled since 2016 / 2017($326K – $343K) and has nearly tripled since the $267,884.55 per library price tag of 1992.
Libraries’ costs are more administrative than before
The costs of running a library is more administrative than ever. 8.92 billion dollars were spent on library staff in 2019, 66.66% of all expenses. In comparison to the 1.45 billion spent on library collections and 3.01 billion on “other expenses”.
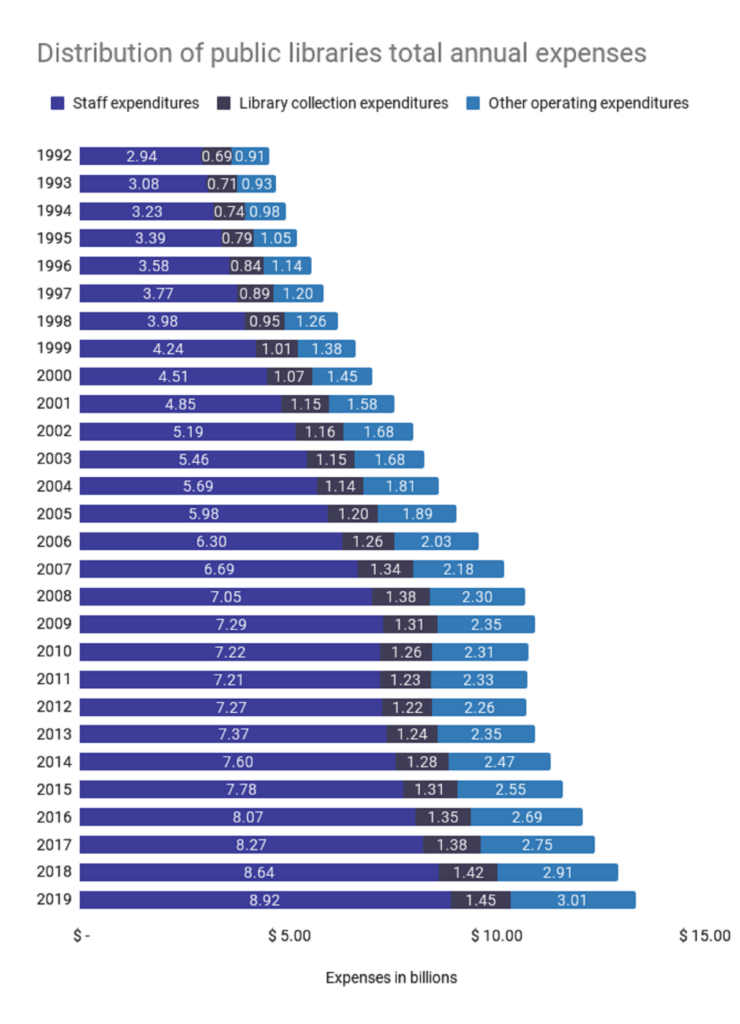
Libraries are spending less of their budget than ever on library collections, accounting for 10.82% of total expenses.
$1.45 billion dollars spent on library collections in 2019 the highest ever
A total of $1.45 billion dollars were spent on library collections in 2019, the highest ever.
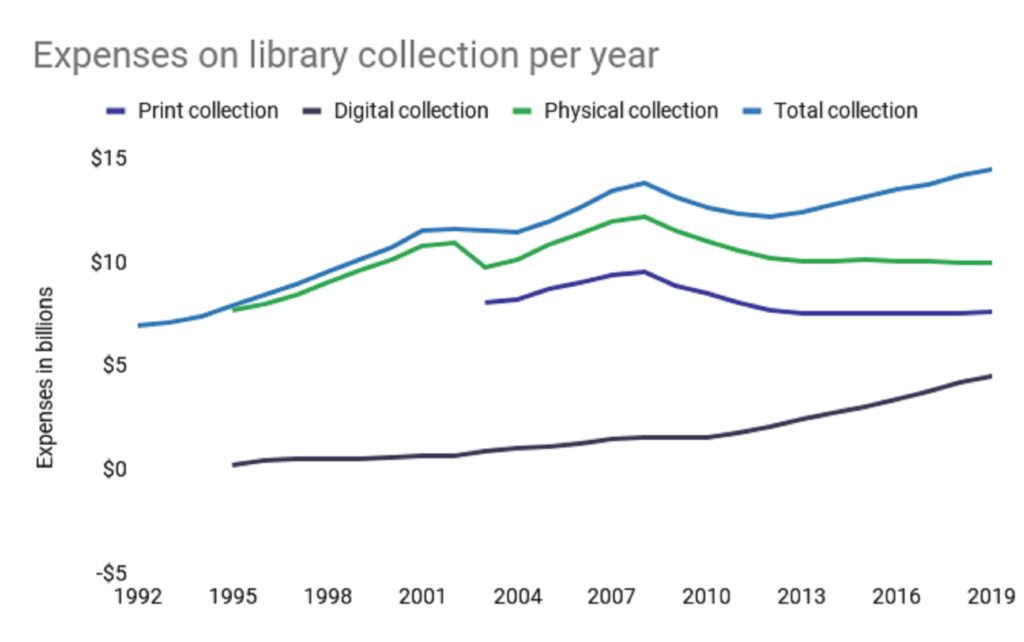
Digital collections like ebooks and audiobooks account for nearly a third (31.04%) of all library collection expenses, up from just 12.00% in 2009 and 5.22% in 1999.
In comparison to 2009, in 2019 library’s spent:
- 10.40% more on total library collection costs – $1.45 billion
- 185.64% more on digital collection costs – $449 million
- 13.49% less on physical collection costs – $997 million
- 14.32% less on print collections costs – $761 million
- 10.73% less on other physical items (audio, video, etc.) – $236 million
Library collection cost per material is cheaper than ever
The average price per item in a library collection is $0.81 in 2019, down 39.55% from it’s $1.34 average price in 2010.
The drop in price per item is due to library collections becoming increasingly digital. This is because the price per digital item has declined significantly. All while the average cost per book increased 10% since 2003.
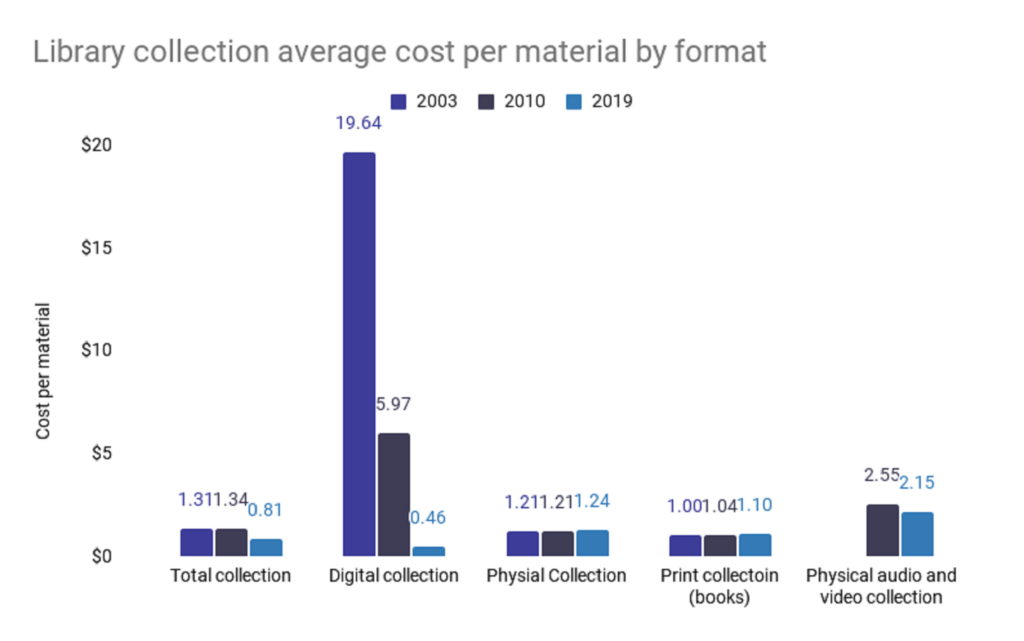
Digital collection items like ebooks and audiobooks are now the cheapest material in a library’s collection, although that wasn’t always the case. Despite costing an average of $0.46 now, they were 1132.60% more expensive in 2010 and 4169.56% more expensive in 2003. ($5.97 and $19.64)
Print materials are 139.13% more expensive than electronic materials but are still 95.54% cheaper than physical audio and video materials.
Physical audio and video materials are the most expensive, costing 367.39% more per material than electronic materials.
Library collection cost per use
Due to the average item in a library collection being borrowed or used an average of 1.23x per year, it costs libraries $0.66 per material borrowed, 39.50% less than the cost per material itself ($0.81).
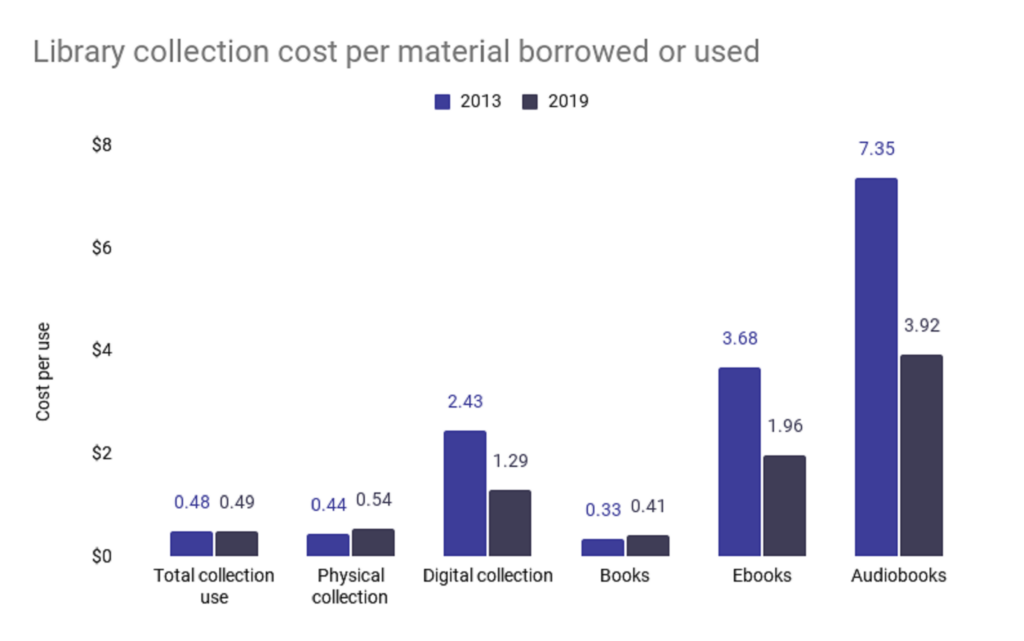
Although digital items may be the cheapest for libraries to purchase, they cost a library more than 3x than a book on a per-use basis. Although, it’s possible for these roles to reverse if the trends of price per electronic material continue to decline alongside increased digital collection use.
This can already be seen playing out through the 46.91$ decrease in cost per digital collection use from 2013 to 2019.
Libraries cannot survive on government funding alone
Total operating income reached an all-time high at a total of $14.31 billion dollars.
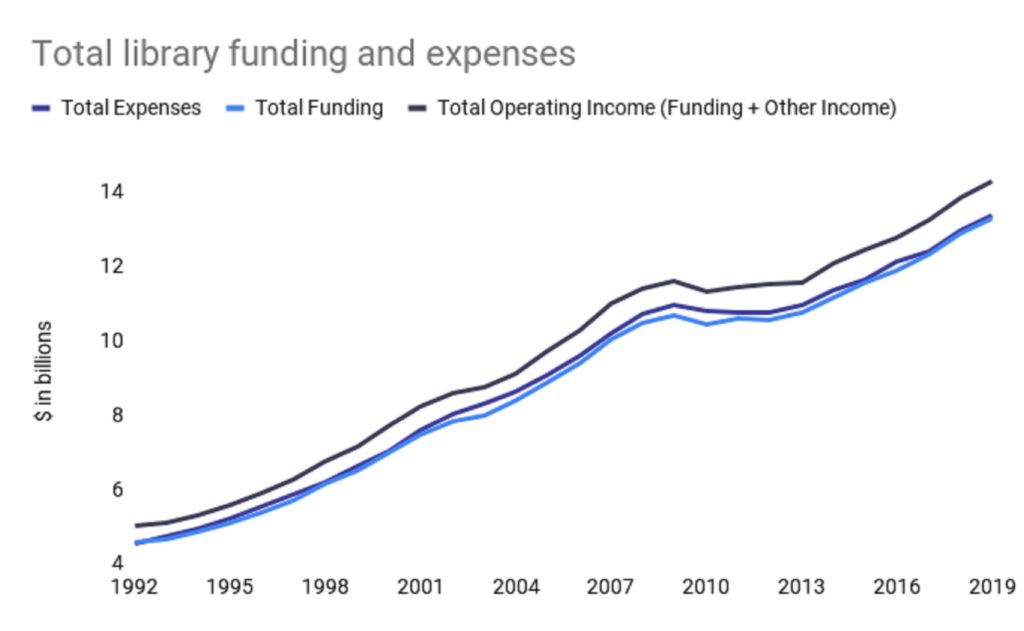
$13.28 billion of the total operating income comes from government funding and $1.02 billion from other income in the form of monetary gifts, donations, interest, library fines, fees for library services, or grants.
Government funding hasn’t covered the annual expenses of public libraries for 27 years,
85.69% of which comes from local governments.
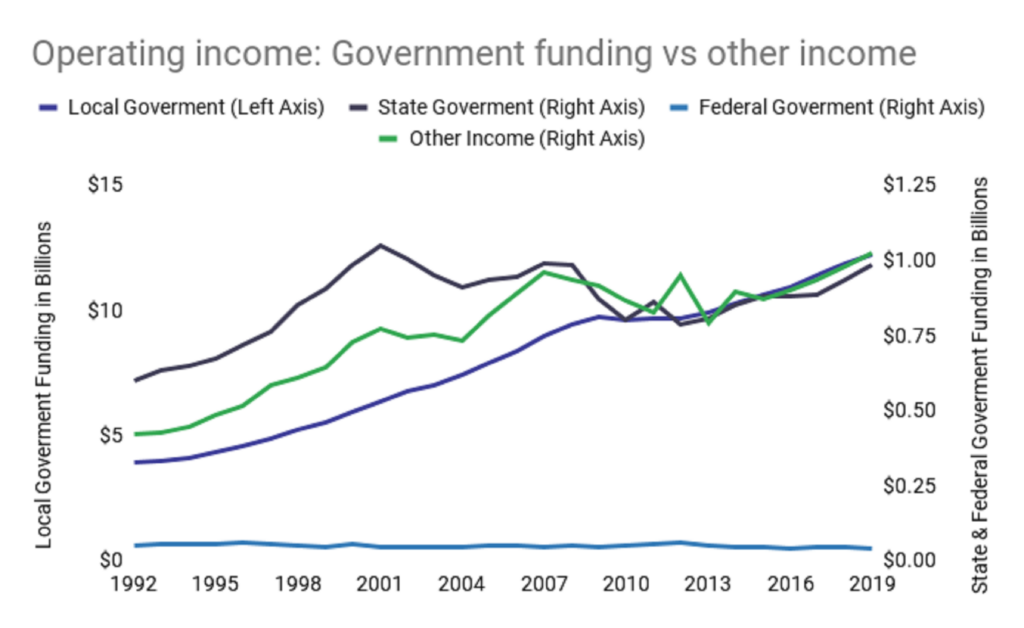
When breaking down the other funding sources, we see:
- Federal government funding has never been lower – dropping 13.14% since 2014 to $39.66 million
- State government funding peaked in 2001 at $1.04 billion – after years of declining since then, it is only just now nearing a return near to record highs with a total of $0.98 billion in 2019
- Other income from donations, grants, fees, and fines surpassed state funding for the first time in 2009 and still provides more operating income as of 2019
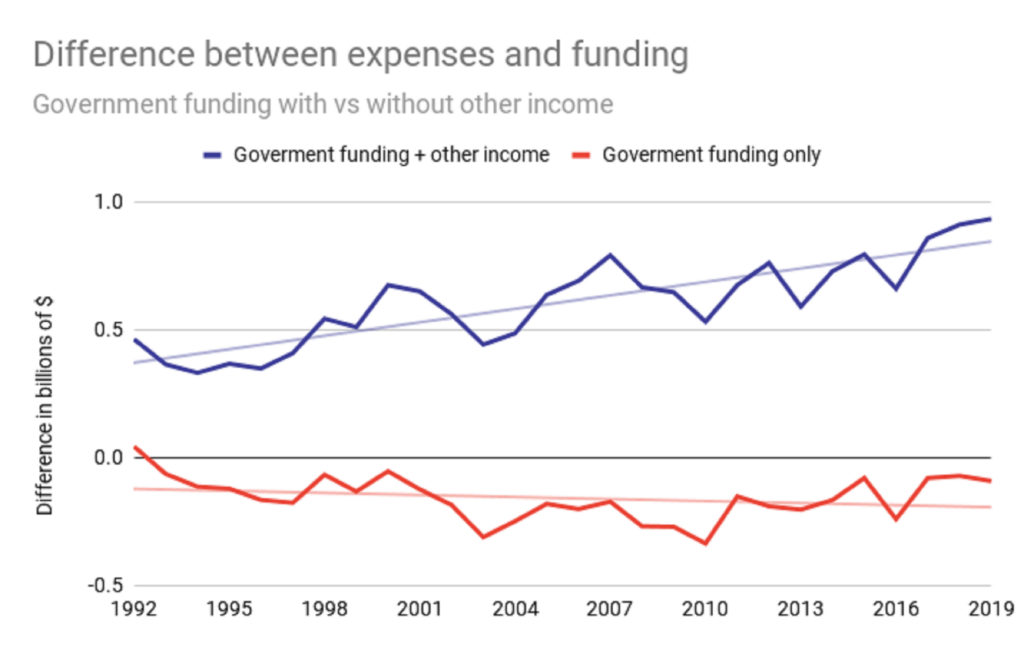
If libraries relied purely on government funding, they would be operating at a total deficit of $4.38 billion.
This has forced libraries to rely on other income sources for the funds to continue serving their communities. Thankfully, this other income has put US Public Libraries in a surplus of $17.05 billion since 1992.
Other income continues trending upwards as well, increasing libraries’ surplus budgets year over year, while government funding is accounting for less and less.
The 25 government funding decreases over the past 27 years haven’t improved the situation either.
| Local Government | State Government | Federal Government | |
| Funding Increases | 26 | 19 | 11 |
| Funding Decrease | 1 | 8 | 16 |
Increasing library funding drives visits, collection use, and programs
Having been underfunded by the government for quite some time, we wanted to understand just how beneficial increasing funding could be. To do this we compared each state’s library funding per capita against performance metrics.
In comparison to the bottom 10 states by funding per capita, the top 10 states had:
- 80.99% more visits per capita
- 9.93% more registered borrowers per capita
- 73.31% more programs per capita
- 81.76% higher program attendance per capita
- 122.49% higher total collection use per capita
- 126.70% higher physical collection use per capita
- 113.52% higher digital collection use per capita
- 104.31% more kids books borrowed per capita
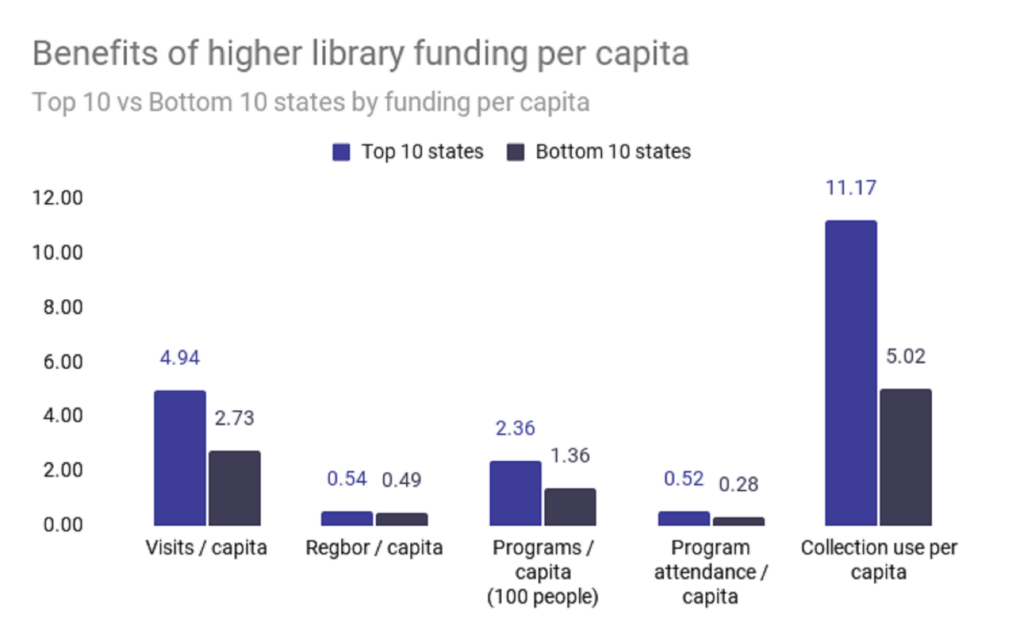
States with greater library funding per capita tend to see significantly better results on a wide range of metrics. Showing the potential clear benefit of increasing government funding of libraries, to help drive engagement and continue to evolve.
Never been more libraries
There are 17468 public libraries in the US, including central libraries, branch libraries, and bookmobile.
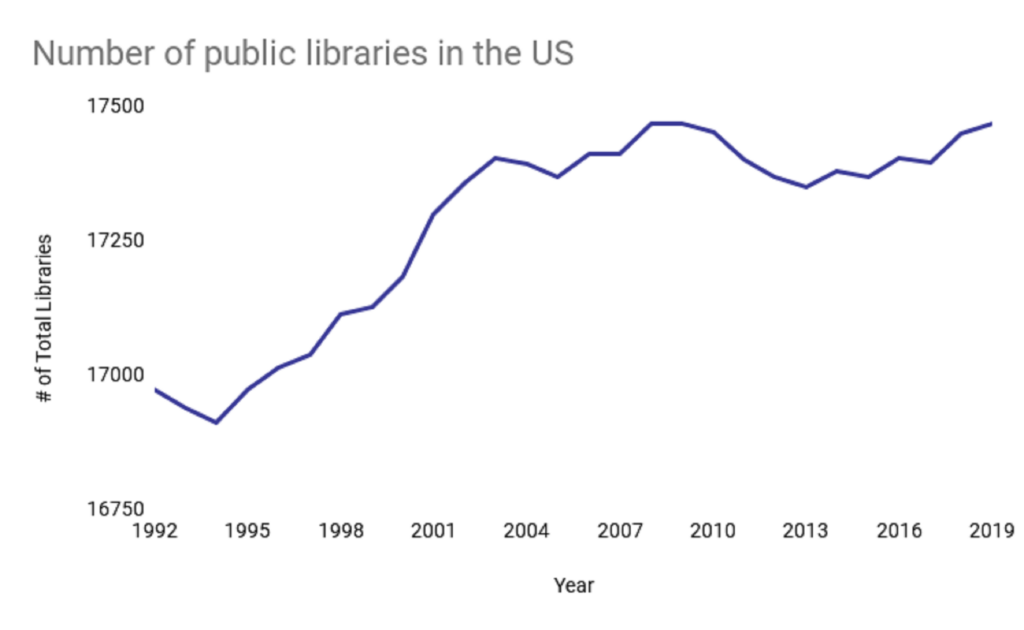
The US has an average of 5.37 libraries per 100,000 people, with an average of 349 libraries per state.
The 5 states with the most libraries had an average of 954.6 libraries, 1359.63% more than the average of the 5 states with the least libraries.
Bookmobiles in decline
Bookmobiles are “mobile libraries” that allow libraries to bring their resources, services, and engagement with their community out of the library.
While the number of central and branch libraries has stayed rather consistent over time, bookmobiles have declined by 39.31% from 1066 in 1992 to 647 in 2015.
That decline then stabilized around 650 mobiles, and with 671 in 2019.
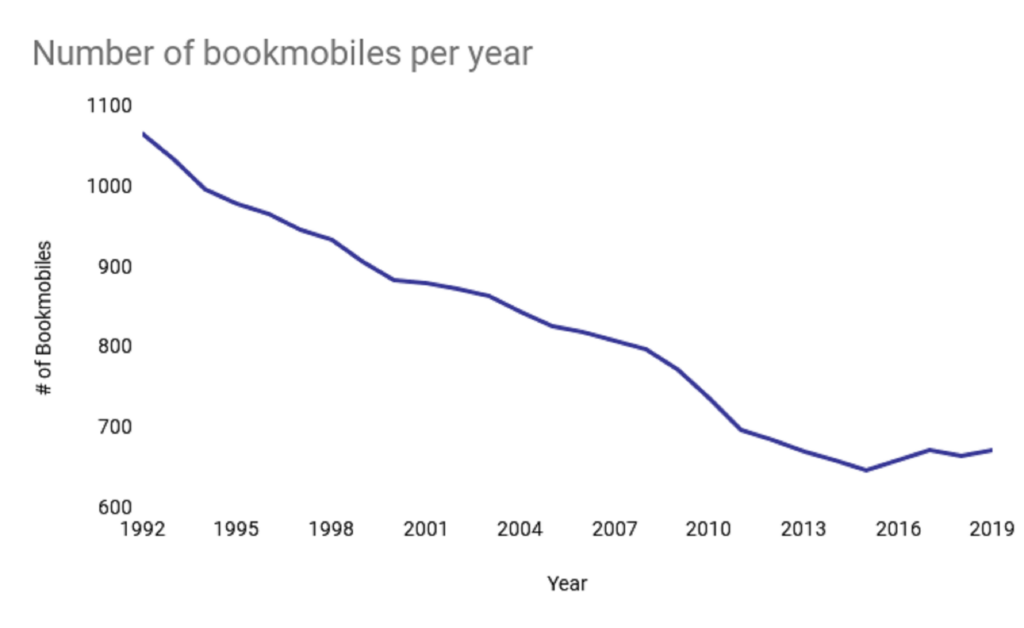
18 states increased their number of bookmobiles by an average of 35.56% while 13 states saw an average decrease of 12.93% from 2014 – 2019.
More librarians than ever – but not a livable wage
Public libraries employ a total of 144.6 thousand librarians and full-time library staff. Only 35.40% of all library staff are librarians (51.19 thousand) – 2/3rds of which have a master of library science degree (34.19 thousand)
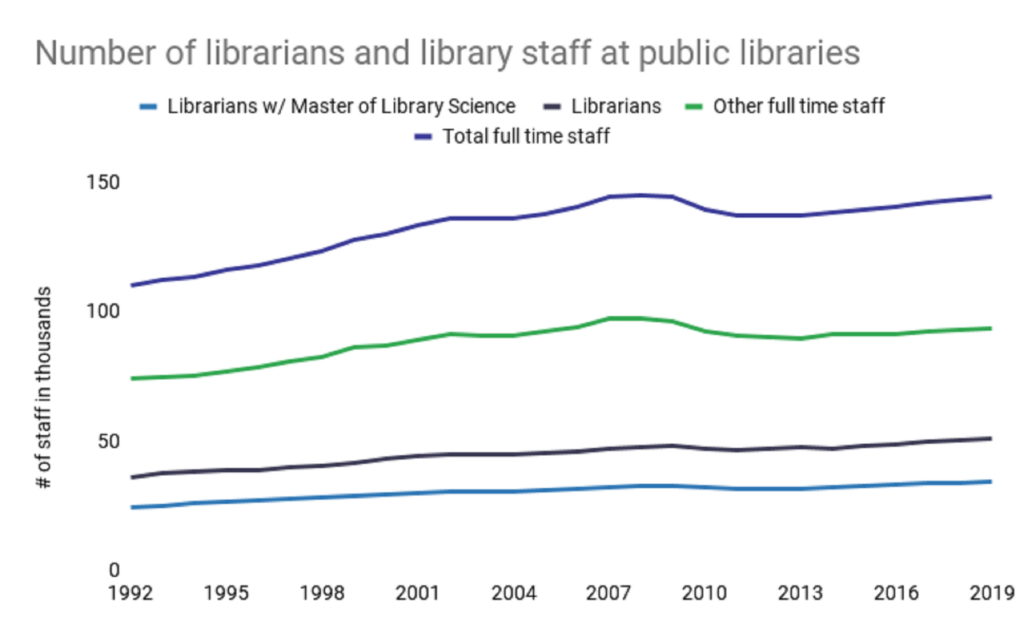
The average expense for each librarian and library staff is $61,659.77.
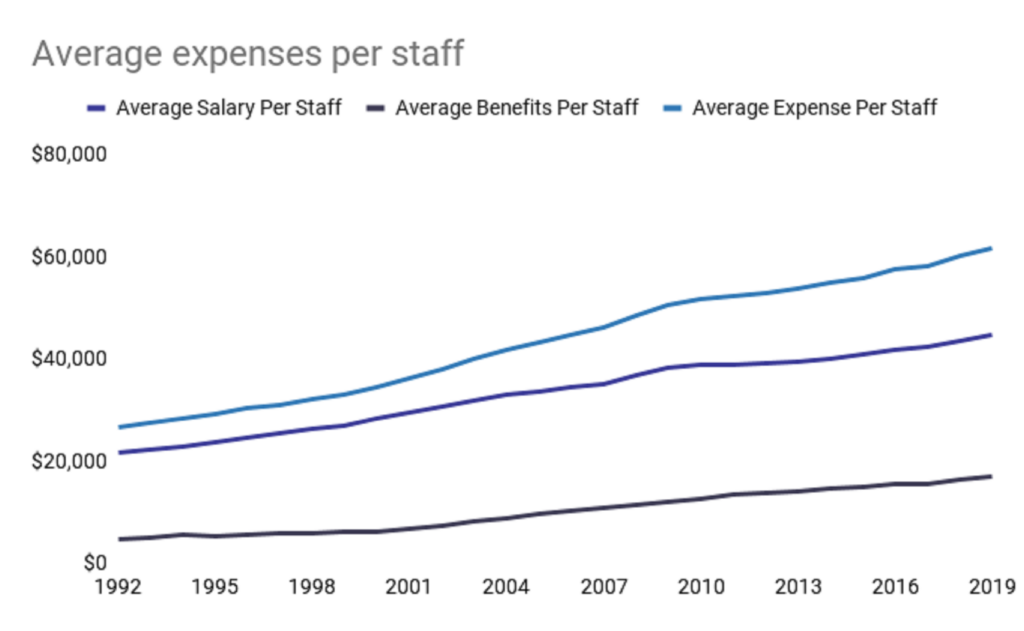
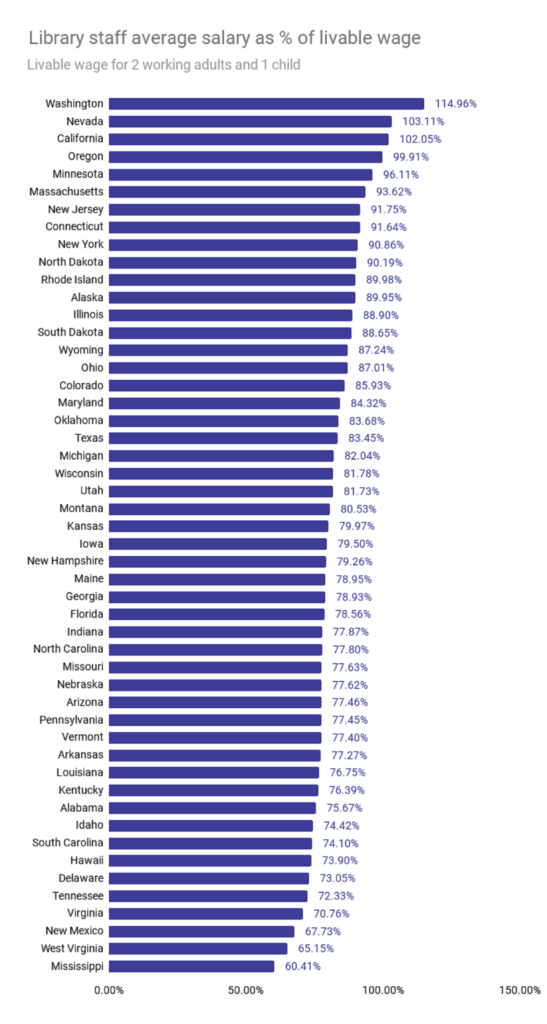
The average full time library staff earned $44,679 (before taxes) in 2019. Even with the average salary increasing 11.08% since 2014, library staff is still paid 35.07% below a living wage for a family of three with two working adults and one child.
Only three states pay librarians and library staff a living wage on average.
Conclusion
Libraries have made a significant digital shift over the years and it isn’t likely to slow down. Because of this, libraries have been able to provide more access to resources than ever.
As the future becomes increasingly digital, so will libraries. As this happens, how libraries use their physical space and the role they play in the communities may change.
Data Source:
For this analysis, we used the IMLS’s Public Libraries Survey (PLS) dataset. The PLS has been collected annually, across the entire US, from more than 17,000 individual public libraries. The digitally available data ranged from 1992 to 2019.
PLS Data is provided annually and had two sets of data to collect, the individual public library dataset and the overall state-by-state dataset. All data was collected and reformatted to match a unified format created based upon the analysis of yearly changes in documentation.
Author Bio

Nick Rizzo
Nick Rizzo is a market and consumer interest researcher, with experience as an educator and director of district-wide literacy initiatives in low-income, urban schools. His research has been cited in scientific peer-reviewed journals and leading publications like the WashingtonPost, Guardian, CNBC, LATimes, and many more.

