- For print newspaper and magazines globally, revenue is expected to drop 13.05% from 2023’s $127.20 billion to $110.60 billion by 2027.
- Contrasting this, global digital newspaper and magazine revenue is expected to grow 11.37% from 2023’s $38.60 billion to $42.99 billion by 2027.
- In the US, more than 124 million adults read published newspaper media each week as of 2018.
- 70% of households with an income that exceeds $100,000 are readers of newspapers.
- 73% of US consumers have confidence in their local newspaper.
- As of 2016, 9 of the top 10 global newspapers ranked by circulation were Asian newspapers.
- Between 2005 and 2021, approximately 2,200 US local print newspapers closed down.
- This amounts to around just under 130 closures per year.
- In terms of employment, the amount of US newspaper journalists dropped by more than 50% between 2008 and 2020.
- Large media corporations now own 80% of all daily newspapers.
Largest US daily newspapers by estimated annual print circulation
- For the given data, the Wall Street Journal has the highest annual print circulation in the US at 254.58 million.
- The Wall Street Journal’s annual print circulation is more than double the size of the next largest, The New York Times 120.37 million.
- Again, The New York Times’ annual circulation is more than double that of the next largest newspaper, USA Today.
- USA Today and Washington Post rank 3rd and 4th and have similar annual circulations, 58.12 million and 58.05 million respectively.
- The fifth largest publication is The New York Post with an annual circulation of 53.53 million.
| # | Newspaper | Circulation (millions) |
| 1 | Wall Street Journal | 254.58 |
| 2 | New York Times | 120.37 |
| 3 | USA Today | 58.12 |
| 4 | Washington Post | 58.05 |
| 5 | New York Post | 53.53 |
A graph is given below to show the largest US daily newspapers by their estimated annual print circulation:

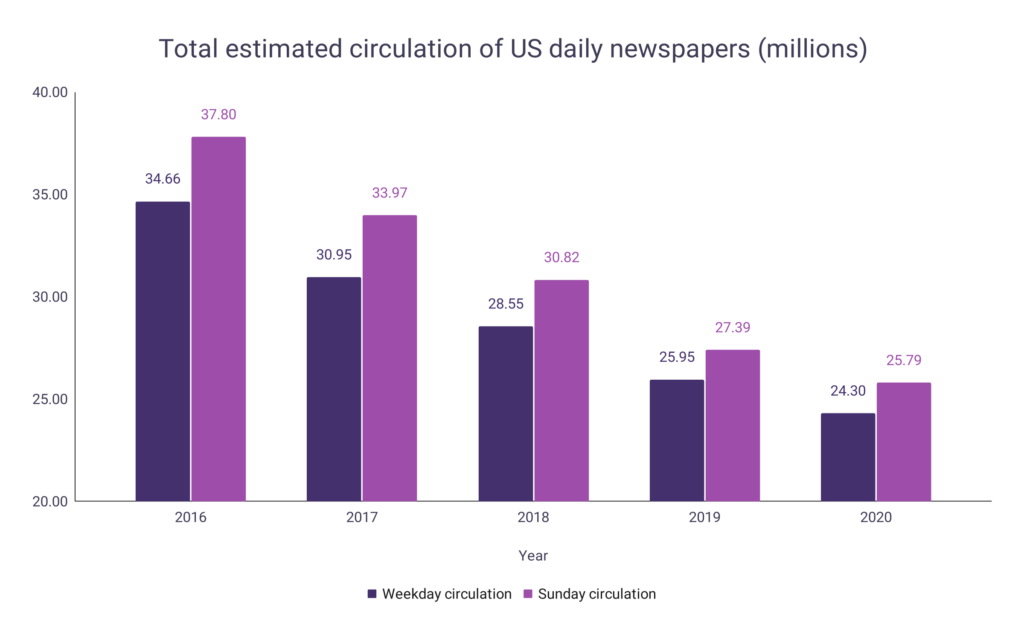
Total estimated circulation of US daily newspapers
- As of 2020, the total estimated circulation of US daily newspapers for weekdays was 24.30 million.
- Over the given 5-year period, weekday circulation dropped by 29.89%.
- As of 2020, the total estimated circulation of US daily newspapers for Sundays was 25.79 million.
- Over the given 5-year period, Sunday circulation dropped by 31.77%.
- All circulation figures decreased year-on-year throughout the period.
| Year | Weekday circulation (millions) | Change | Sunday circulation (millions) | Change |
| 2020 | 24.30 | – 6.36% | 25.79 | – 5.84% |
| 2019 | 25.95 | – 9.11% | 27.39 | – 11.13% |
| 2018 | 28.55 | – 7.75% | 30.82 | – 9.27% |
| 2017 | 30.95 | – 10.70% | 33.97 | – 10.13% |
| 2016 | 34.66 | 37.80 |
A graph is given below to show the total estimated circulation of US daily newspapers:

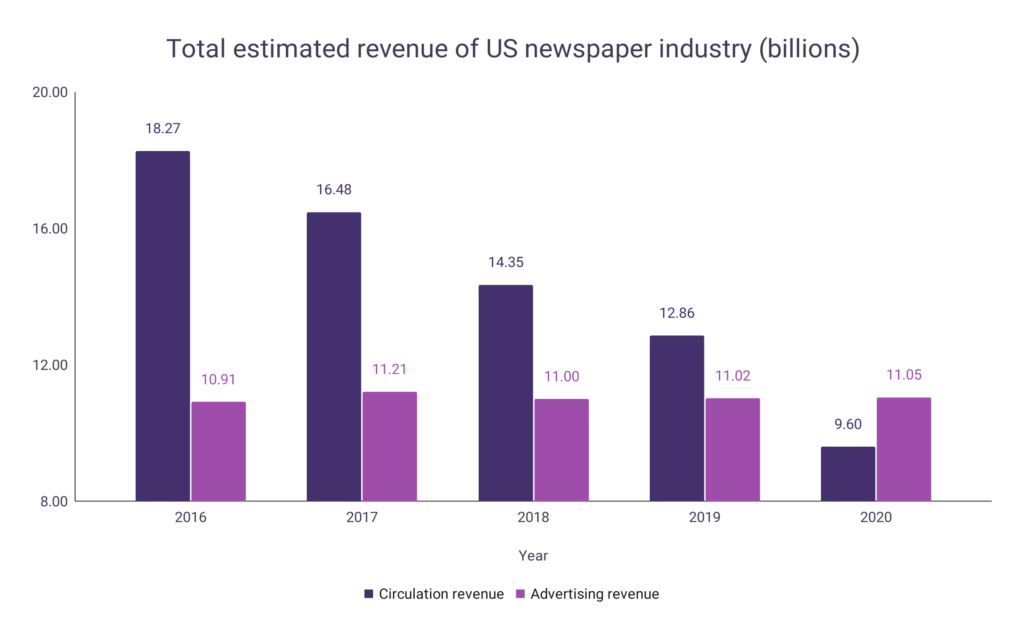
Total estimated revenue of US newspaper industry
- As of 2020, the total circulation revenue of the US newspaper industry was $9.60 billion.
- Over the given 5-year period, circulation revenue dropped by 47.45%.
- As of 2020, the total advertising revenue of the US newspaper industry was $11.05 billion.
- Over the given 5-year period, advertising revenue increased by 1.28%.
- Circulation revenue figures decreased year-on-year whereas advertising revenue remained mostly stable throughout the period.
| Year | Circulation revenue (billions) | Change | Advertising revenue (billions) | Change |
| 2020 | $9.60 | – 25.35% | $11.05 | + 0.27% |
| 2019 | $12.86 | – 10.38% | $11.02 | + 0.18% |
| 2018 | $14.35 | – 12.92% | $11.00 | – 1.87% |
| 2017 | $16.48 | – 9.80% | $11.21 | + 2.75% |
| 2016 | $18.27 | $10.91 |
A graph is given below to show the total estimated revenue of the US newspaper industry:

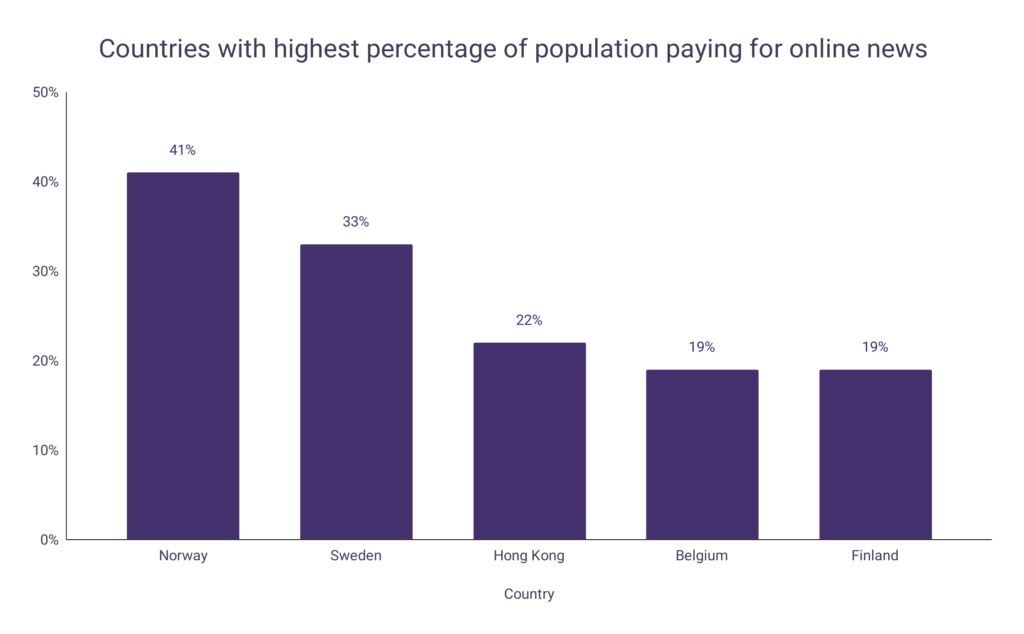
Percentage of consumers paying for online news by country
- As of 2022, for the given data the country with the highest percentage of its population paying for online news is Norway (41%).
- The percentage of Norway’s population paying for online news is 8% higher than the next highest country.
- 33% of Sweden’s population (2nd) pay for online news.
- 22% of Hong Kong’s population (3rd) pay for online news.
| Country | Percentage |
| Norway | 41% |
| Sweden | 33% |
| Hong Kong | 22% |
| Belgium | 19% |
| Finland | 19% |
| Philippines | 19% |
| United States | 19% |
| Australia | 18% |
| Brazil | 18% |
| Denmark | 18% |
| Indonesia | 18% |
| Mexico | 18% |
| Switzerland | 18% |
| Malaysia | 17% |
| Netherlands | 17% |
| Singapore | 17% |
A graph is given below to show the countries with the highest percentage of consumers paying for online news:

Newspaper readership behavior
Attitudes to print
- 64% of readers that prefer print find that physical newspapers allow them to read more easily.
- 53% of print newspaper subscribers have held their subscription for 5+ years.
- Printed newspapers are noted to be the primary source of information for 3% of US adults.
- However, 25% of US adults aged 65+ still receive their news from print publications.
- 79% of elderly print subscribers believe it is unlikely they will switch over to digital.
Attitudes to digital
- As of 2022, 19% of news readers in the US paid for access to digital newspapers.
- Most paid readers hold a subscription to their preferred print paper’s digital version.
- Within the US, 39% of newspaper subscriptions were with The New York Times and 31% subscribed to The Washington Post as of 2020.
- However, 30% chose to hold subscriptions to the digital version of their local paper.
- 64% of readers that have digital subscriptions do so for accessibility reasons.
Attitudes to advertisements and coupons
- 91% of newspaper readers disclose that they take action after reading newspaper inserts.
- 79% of newspaper readers are influenced to take action within 30 days of reading a newspaper advert.
- Print coupons given in newspapers are used by 82% of all consumers.
- 70% of people aged 18+ agree that newspapers are their preferred source for receiving coupons.
- Consumers believe newspapers provide the best opportunities to be alerted to sales.
Newspaper Sales FAQ
Why are newspaper sales falling?
- The increasing importance of the internet for search has decreased the need for consumers to purchase physical print newspapers.
- Over time, this has caused advertising revenue to fall which has led to many newspapers reducing their numbers of employees.
- These staff number reductions contribute to yet further circulation decreases and losses of revenue, causing problems for the industry.
How are newspapers responding to lower print sales?
- Newspaper companies have mainly looked to focus on digital readership to find new sources of revenue. Their digital strategies include:
- Digital subscriptions to allow users to fully access their newspaper online.
- Social media to create new forms of content that can be monetized.
- Apps to host their news stories, encouraging membership and interactivity.
- Advertisements that drive users to their pages from around the web.
Which newspaper has the largest circulation?
- As of 2019, the Japanese newspaper Yomiuri Shimbun was credited as having the largest circulation in the world.
- The newspaper is printed twice a day and also has several local editions.
- As of 2021, its morning circulation was 7 million.

